Analysis by Business Central's Dimensions

Welcome to the Dimensions Tutorial for Business Central Insights, the analytics suite that brings advanced dimensional analysis from Microsoft Dynamics 365 Business Central directly into Power BI.
This tutorial explains how dimensions work, how Business Central stores and uses them, and how our apps transform raw dimensional data into advanced, flexible analytics, including 12 custom dimensions, dimension hierarchies, total dimensions, default dimensions, and extended custom dimension fields.
Introduction to Dimensions
Dimensions in Business Central are tags you attach directly to transactions, ledger entries, and documents to describe what, where, who, or why something happened.
https://learn.microsoft.com/en-us/dynamics365/business-central/finance-dimensions
Common examples include:
Departments
Projects
Regions
Customer Groups
Item Categories
Industry
Salespeople
Because dimension values are stored on every posted entry, they form a historically accurate record of your business activity. Changing a dimension later does not rewrite history, only future postings will reflect the new value.
For example, if you update the Salesperson on a customer card, all future sales invoices will carry the new salesperson dimension, but historical sales entries remain unchanged. This is intentional: dimensions are meant to show how the business truly operated at each moment in time.
In contrast, Default Dimensions work differently. A default dimension is a dimension value assigned to a master record, such as a Customer, Vendor, Item, Resource, or G/L Account, and it is copied onto the transaction when you create it. This ensures consistency and reduces manual data entry. Default dimensions can also be set to:
Always require a value
Provide a suggested default
Block incompatible combinations
Because default dimensions belong to master data (not the transaction itself), filtering reports by these defaults effectively filters the entire history of entries associated with that customer, vendor, or item.
For example: if you change the default Salesperson on a customer card today, filtering your reports by that default dimension will include all historical transactions for that customer, even those originally posted by a different salesperson. This is because the filter is based on the customer record, not the historical transaction dimension values.
In summary:
Transaction Dimensions = stored directly on posted entries → historically accurate, never retroactively changed.
Default Dimensions = templates attached to master data → copied to new transactions, and ideal for consistent filtering across the entire account history.
Business Central Insights enhances both approaches by allowing advanced analysis using transaction dimensions and default dimensions, including full support for dimension hierarchies and total dimensions across all analytical dimensions.
Dimension Setup
For guidance on selecting and setting up these dimensions for optimal reporting, please visit Dimension Setup page.
https://businesscentralinsights.com/dimension-setup
Analysing Data by Multiple Dimensions
With the Business Central Insights apps, you can analyse any dataset across multiple dimensions simultaneously.
In this example, we’re drilling down through Area → Department → Salesperson → Sector to explore performance at each level.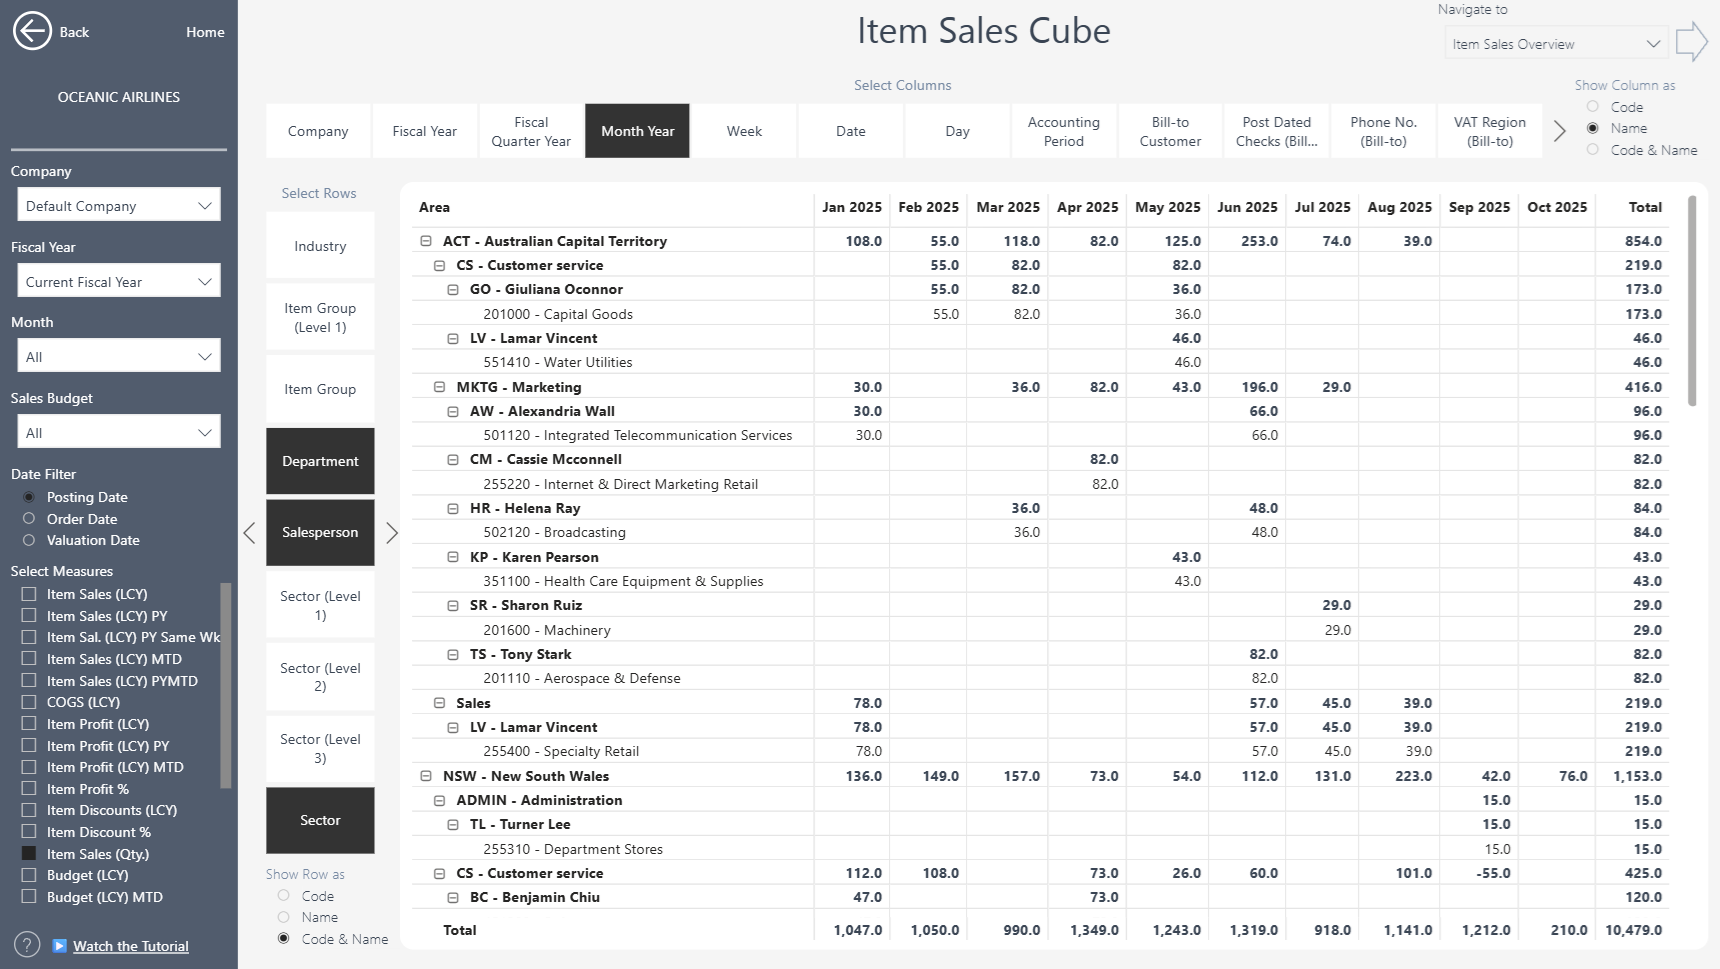
Dimension Hierarchies (Dimension Value Type = End Total)
Hierarchy support enables you to analyse dimension values by structured roll-ups.
For each of the dimensions, we support up to 4 levels.
Why this matters
Hierarchies enable high-value analytics such as:
Regional → Sub-regional → Country → City reporting
Parent Project → Subproject breakdown
Brand → Product Category → Product Line → SKU roll-ups
Management structure reporting (Division → Department → Team)
Important: Totalling Filter Format
To define hierarchy roll-ups correctly, the Totalling filter on End Total dimension values must follow this format:
<Start Code>..<End Code>
Use the start dimension code, followed by two dots (..) to indicate a range, ending with the end dimension code.
Example:
100..199 - Includes all dimension values from 100 to 199.
In this example, the Sector dimension is organized into four hierarchical levels, ranging from the broad sector at the top down to the specific industry at the most detailed level.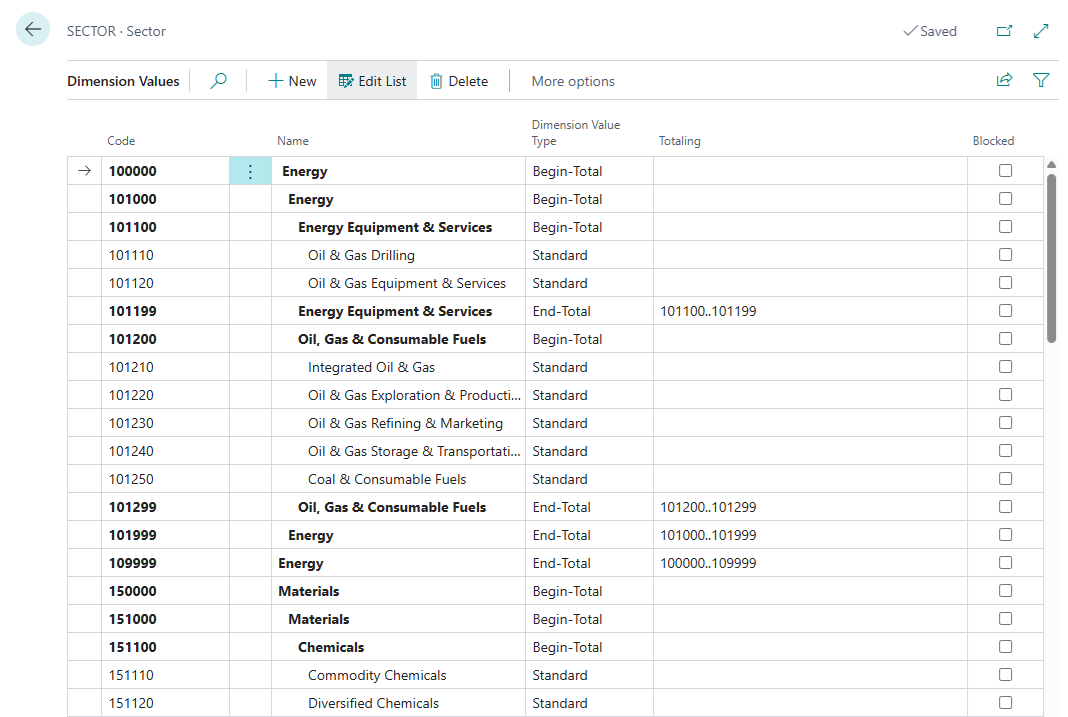 All hierarchy levels are available in both our Cube and Table Power BI reports, allowing you to place any level in the rows or columns for flexible analysis.
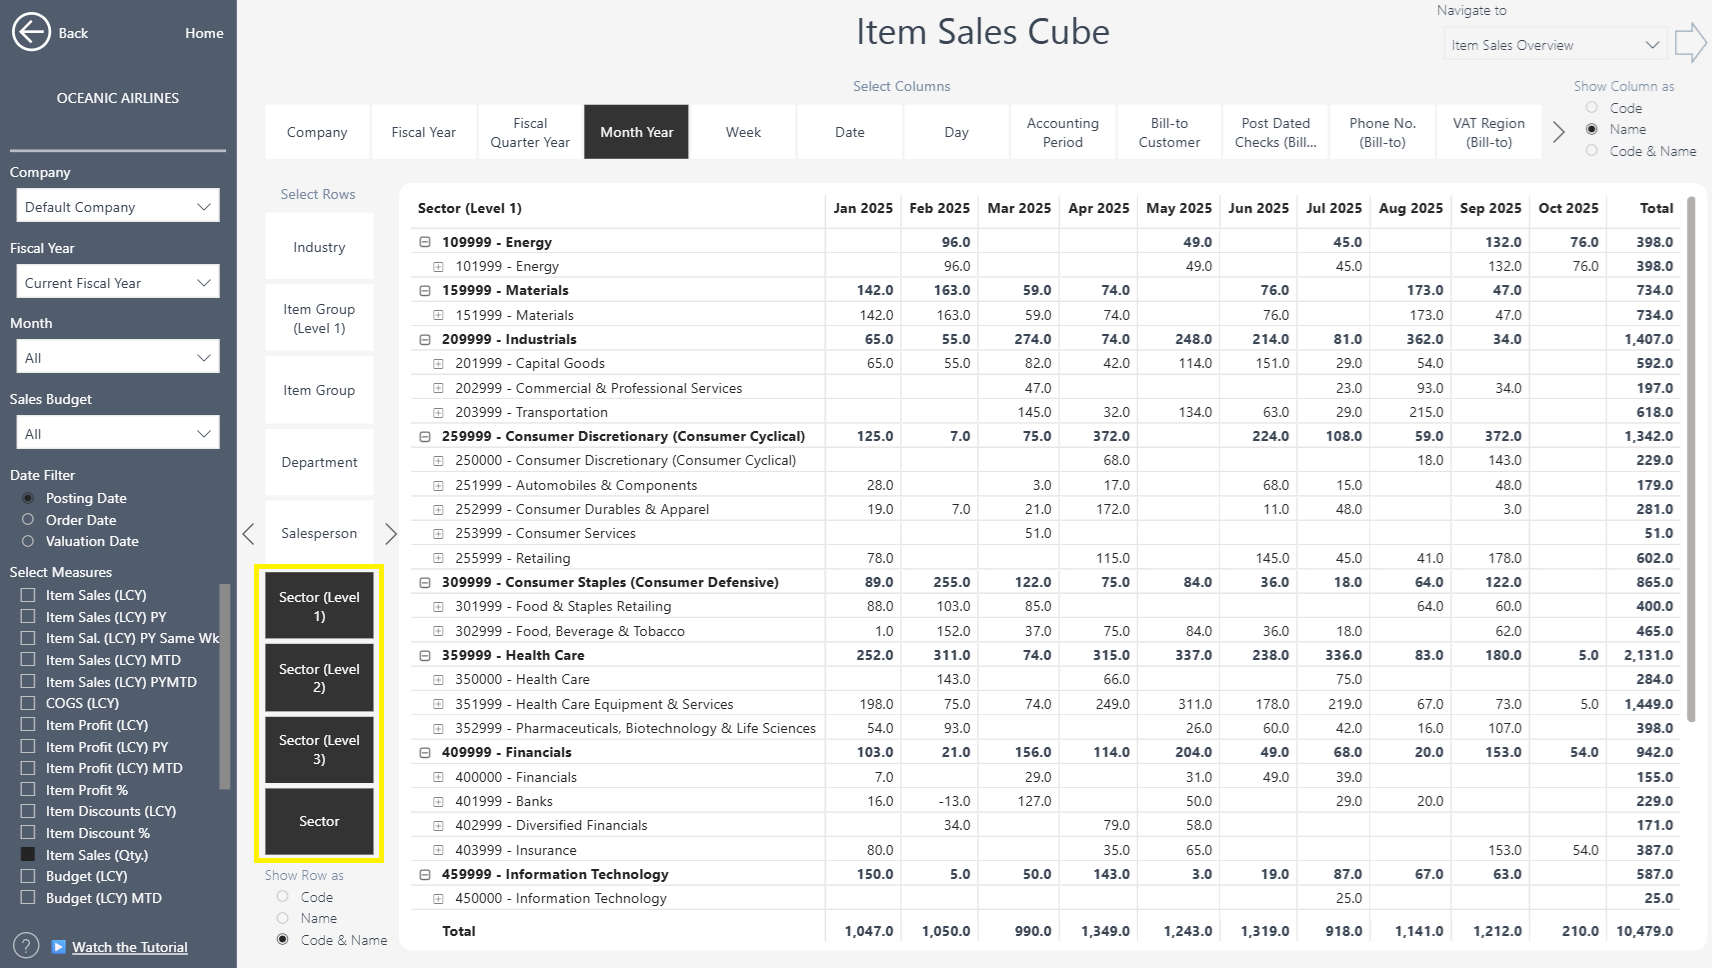
Dimension Totals (Dimension Value Type = Total)
Business Central allows configuring Dimension Value Type = Total, which lets you group dimension values manually using the Totaling field.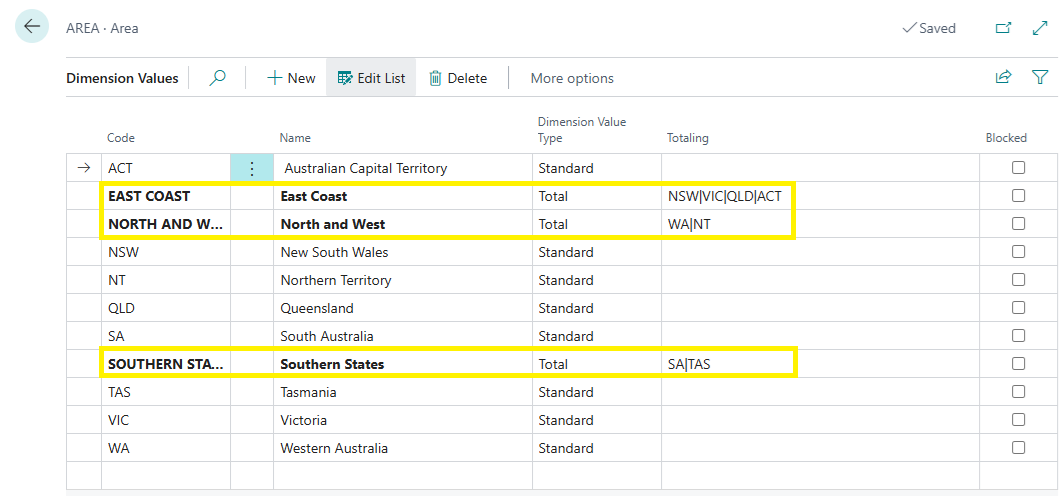 This enables:
Custom roll-ups not defined in hierarchies
Ad-hoc reporting groups
Flexible regional, product or customer clusters
Management-defined summaries without structural changes
Important: Supported Filters in the Totalling Field
The Totalling field supports all standard Business Central filter formats, including:
| (pipe) — to list multiple specific dimension codes
Example: DE|FR|NL
.. (range) — to define a continuous range of codes
Example: 100..199
Combinations of both for flexible roll-ups
Example: 100..120|200|305..399
This gives you full freedom to build custom groupings that reflect your business structure - without altering your Dimension Hierarchy.
Our apps fully support Total dimension values. All Total levels are available in both Cube and Table Power BI reports, allowing you to analyze your data using your custom Totaling definitions.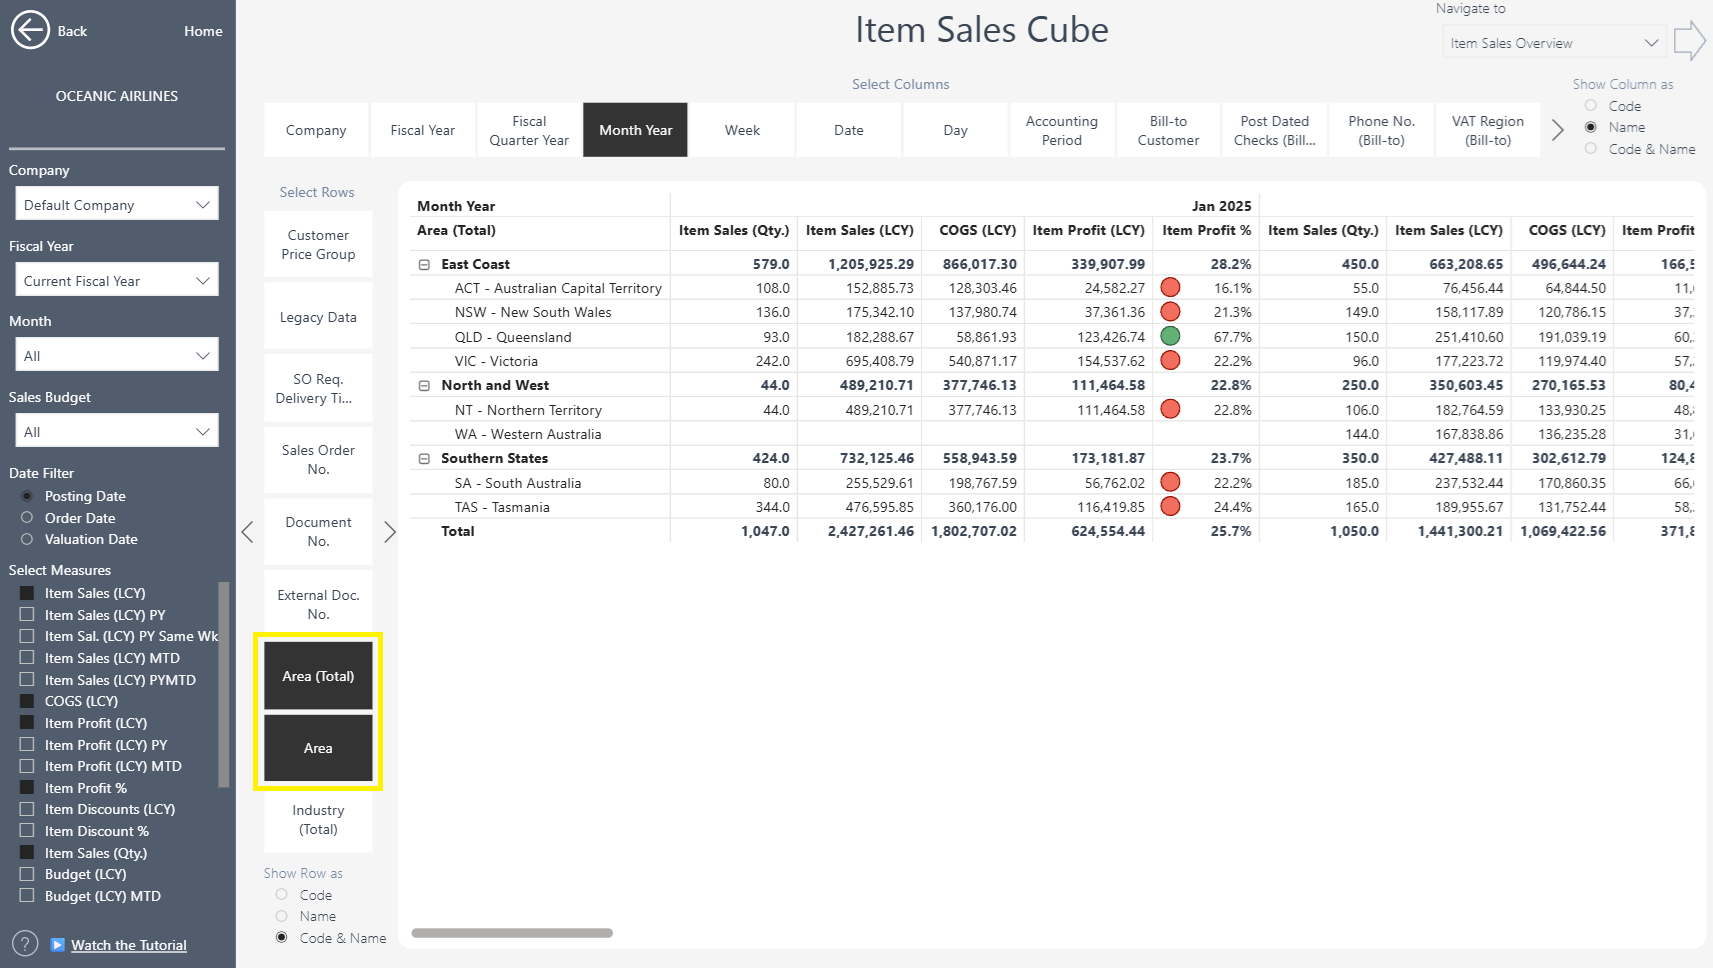
Default Dimensions Support
In the “Introduction to Dimensions” chapter, we explained how Default Dimensions work and how they differ from transaction dimensions. In our current release, we support Default Dimensions for Items, Customers, and G/L Accounts.
Configuration is done through the Dimensions Setup page in the Power BI Insights Connector app. Full instructions can be found here: https://businesscentralinsights.com/dimension-setup
To analyze your data using these Default Dimensions, ensure that Show More = True so that all available fields are visible within the Cube or Table reports.
In this example, we are displaying the Item Group (an Item Default Dimension) across two hierarchy levels.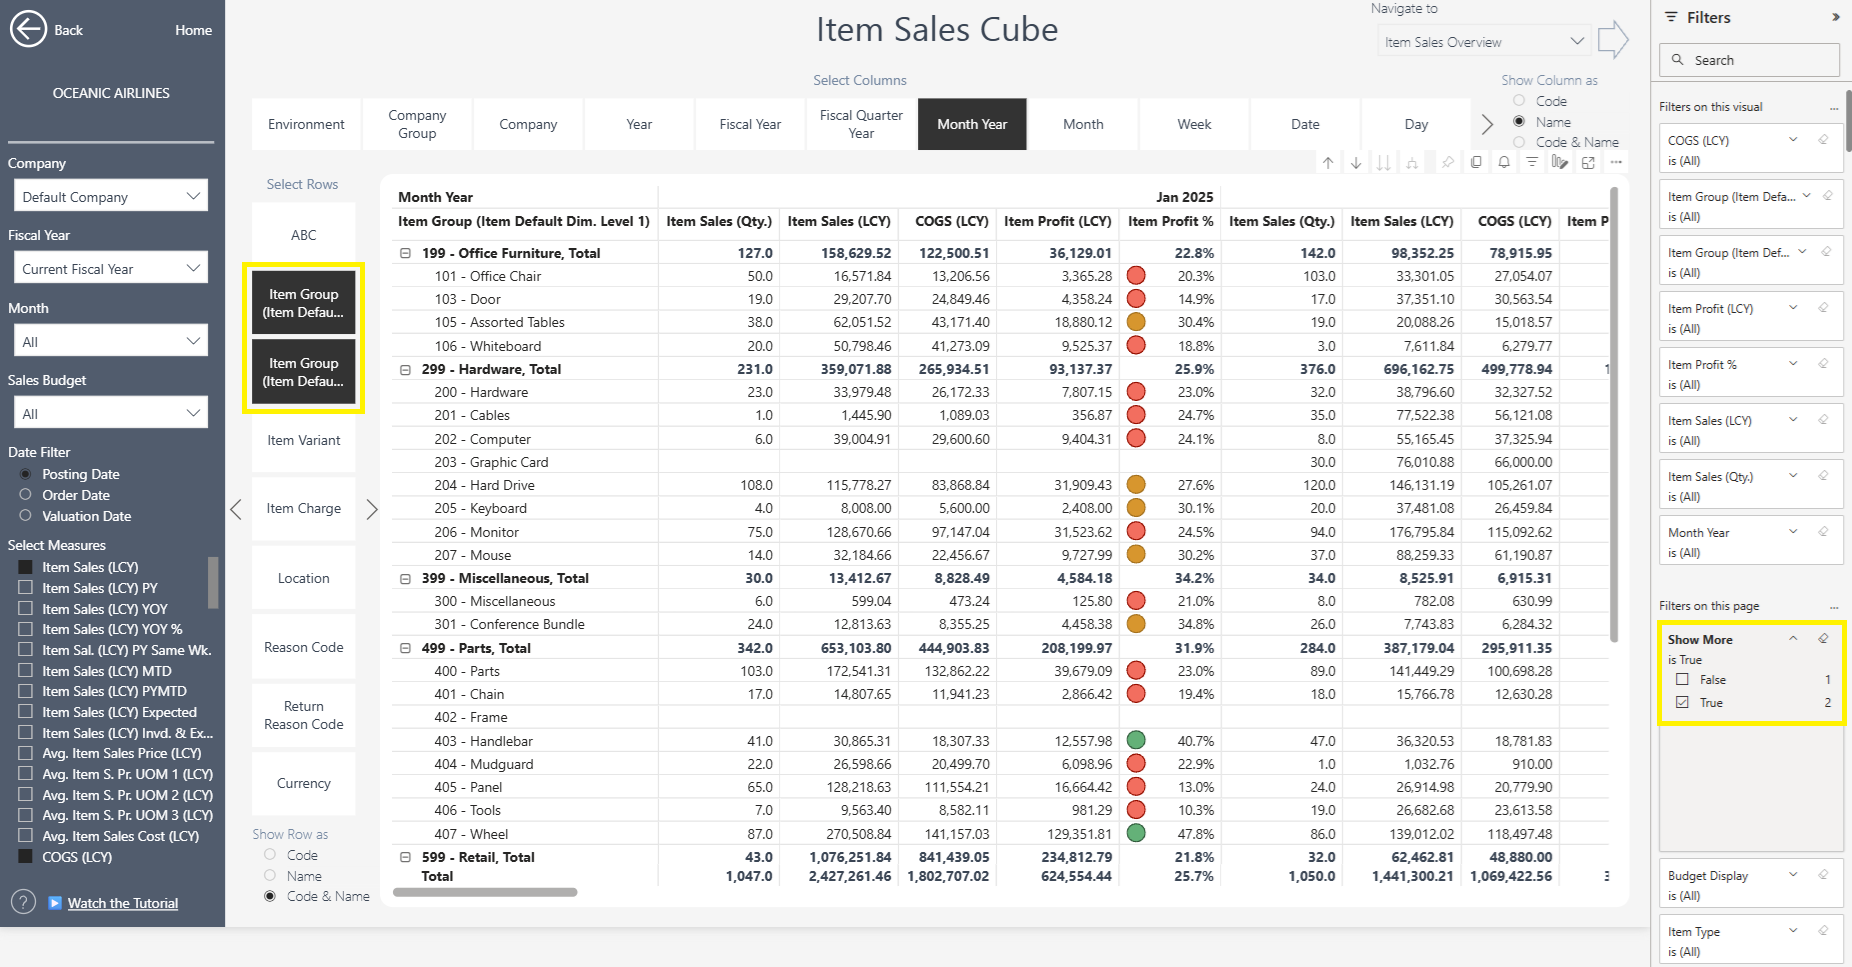
Extending Dimensions with Custom Fields
Our Table Extension Framework allows you to:
Add custom fields to any dimension
Include those fields in Power BI reporting
Here’s more information on table extensions: https://businesscentralinsights.com/table-extensions
Summary: How Dimensions Flow into Business Central Insights Power BI Reports
Our reports use optimized fact tables and dimension tables that allow:
Slicing any factual metric by any dimension
Multi-dimensional filtering (all 12 dimensions at once)
Fast hierarchical drill-down
Support for Total lines and inherited totals
Default Dimensions at item, customer and G/L account level
Custom fields supported via Table Extensions
Optimized DAX for performance even on large datasets