Business Central Insights Financial Reporting Analytics

Introduction
Financial reporting in Business Central Insights transforms static statements into interactive insights in Power BI. Your familiar row definitions from Business Central are carried across, so you can analyze Balance Sheets, Income Statements, and Cash Flow with the flexibility to filter, drill down, and slice by company, period, or dimension. With clear visuals, customizable totals, and cross-company analysis, you can move seamlessly from high-level overviews to detailed line-level insights, making reporting faster, clearer, and more actionable.
Financial Statement examples:
You can configure multiple financial statements depending on your needs, the 3 most commonly used financial statements in Power BI are:
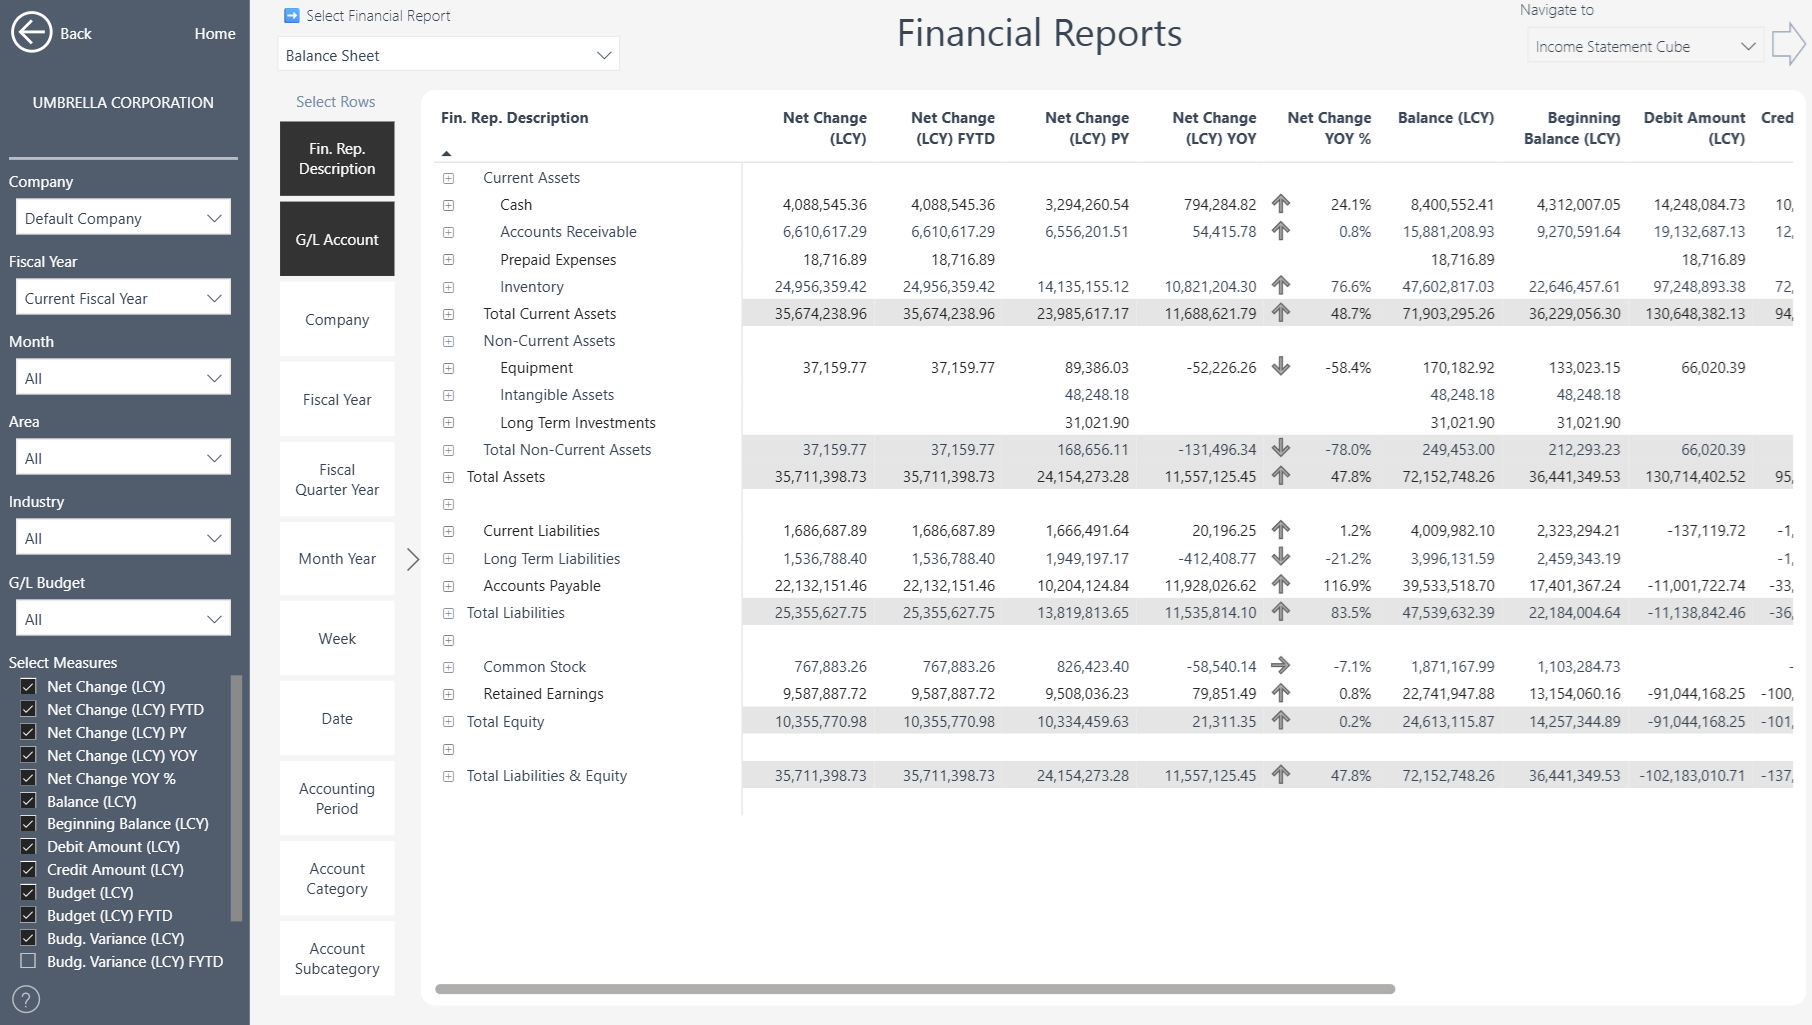
Balance Sheet
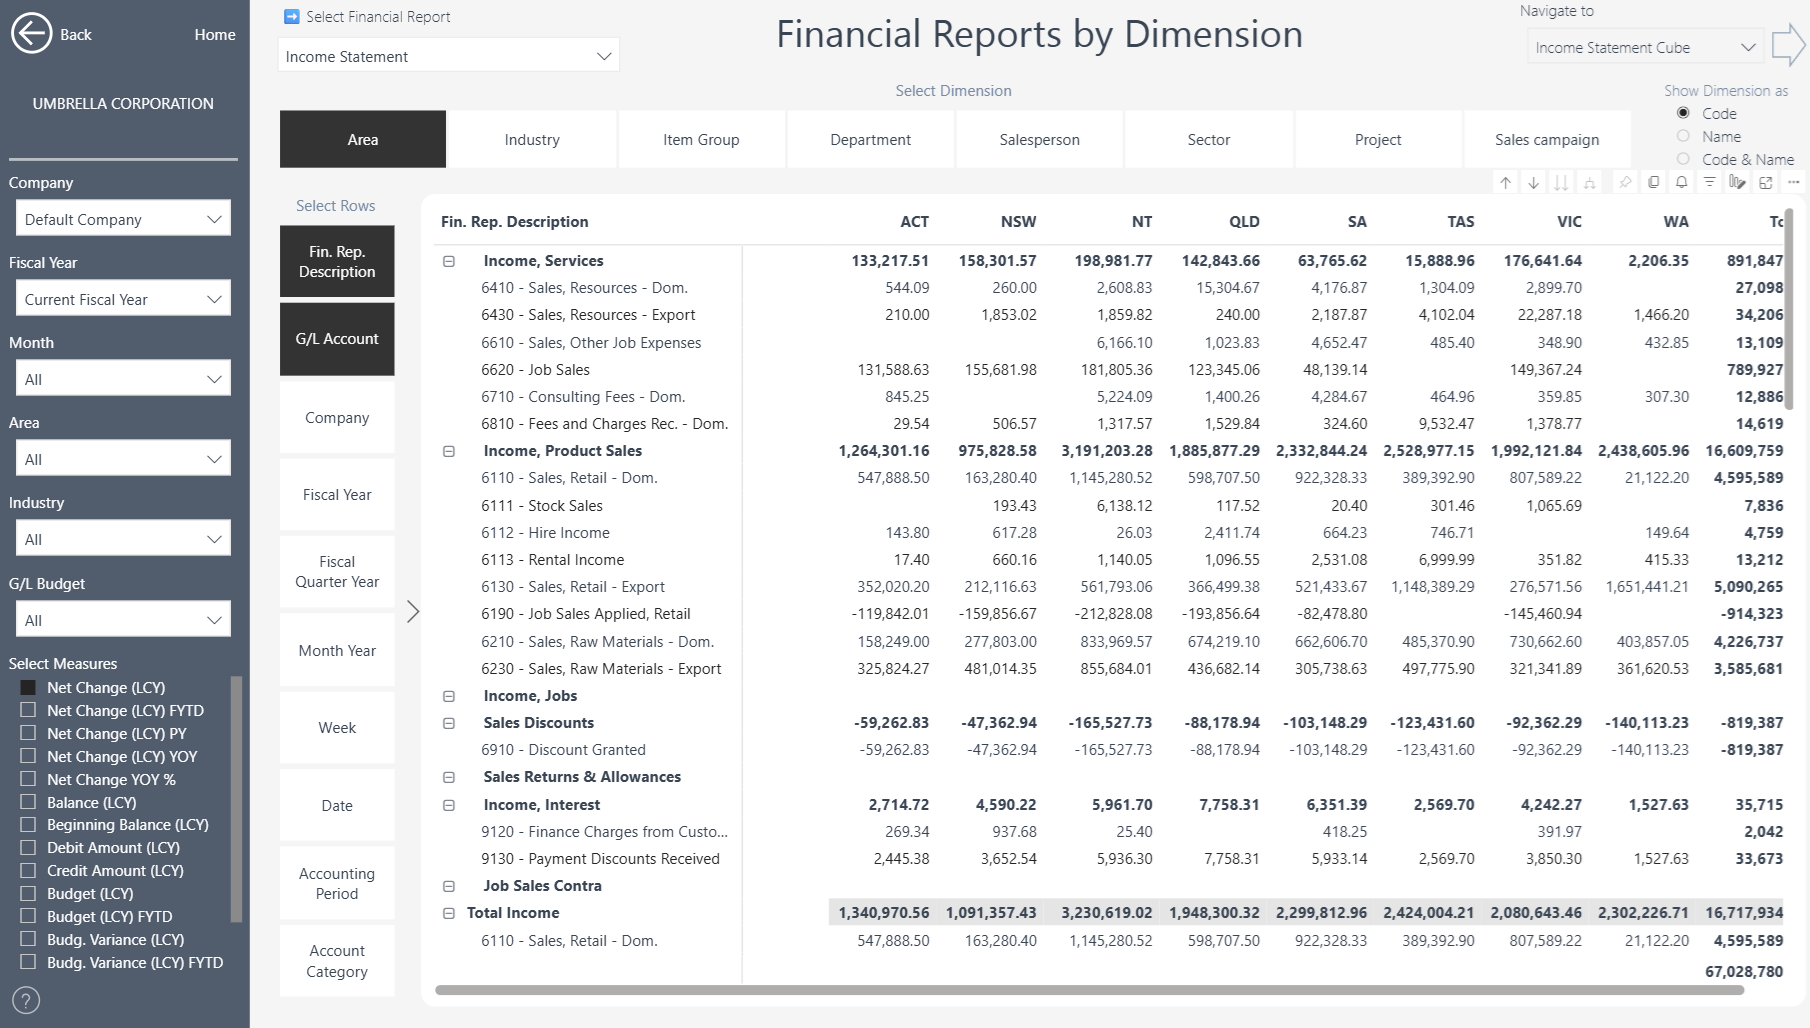
Income Statement by Dimension
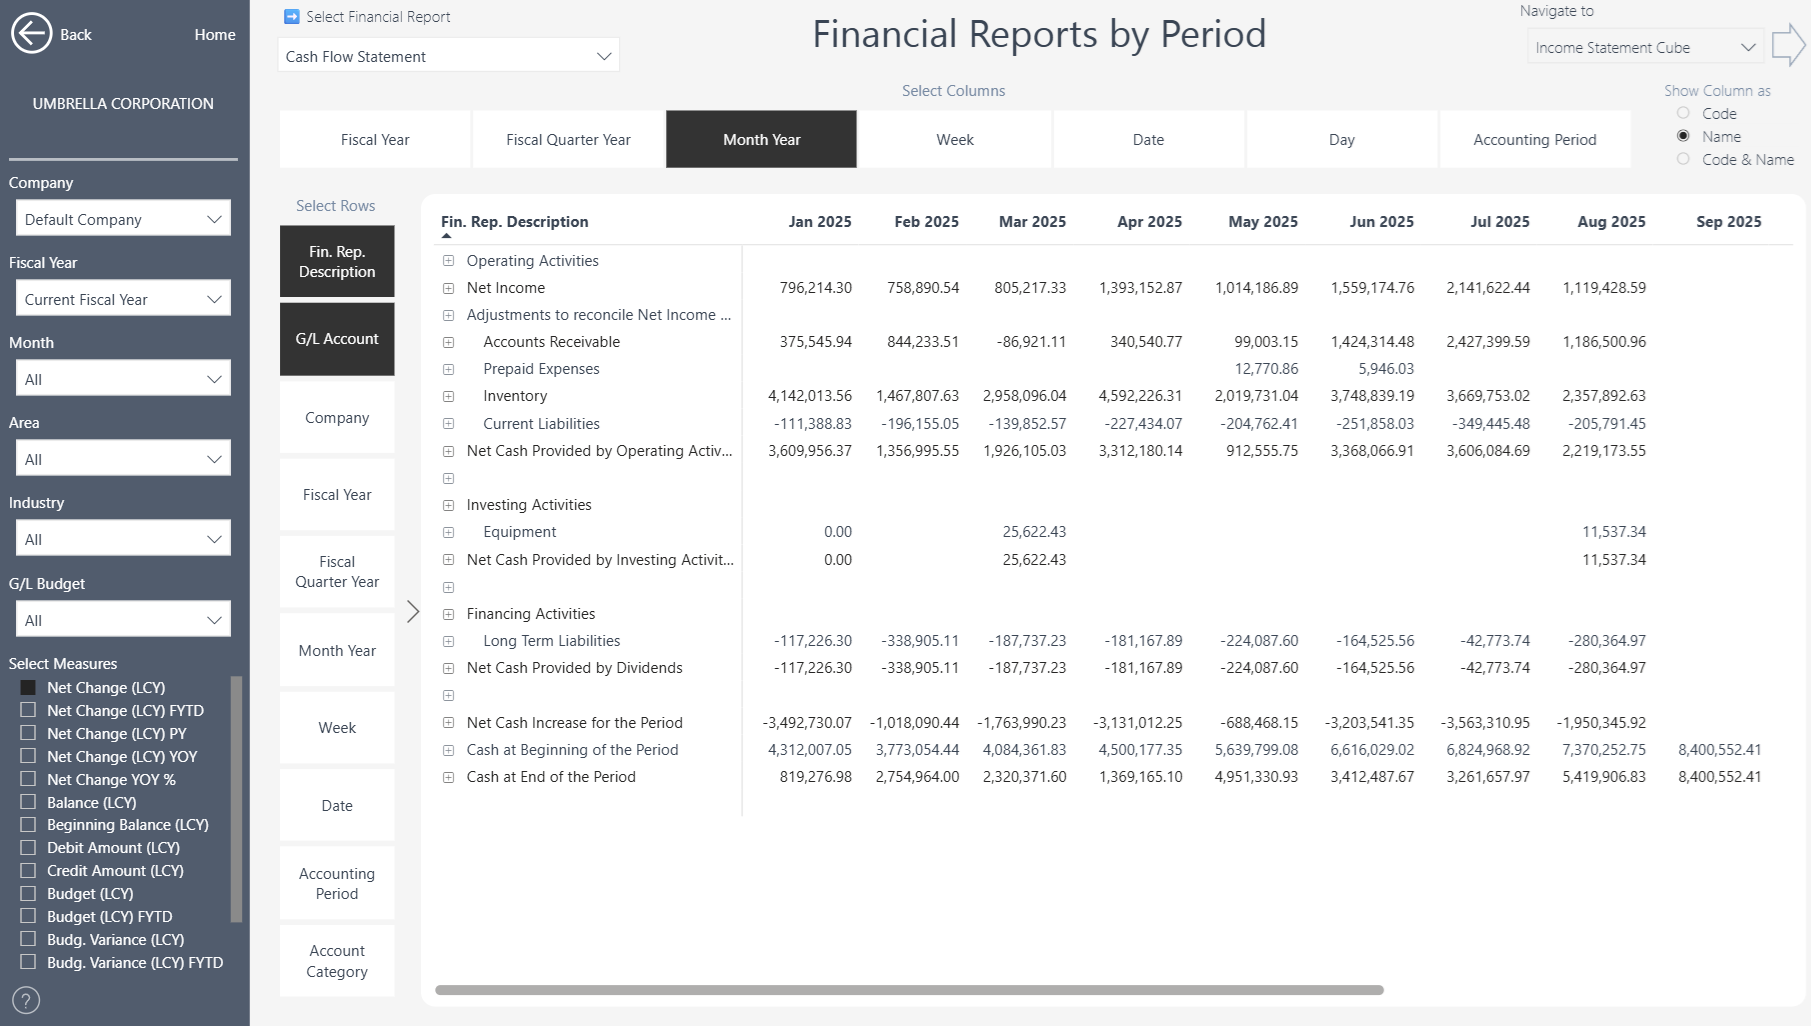
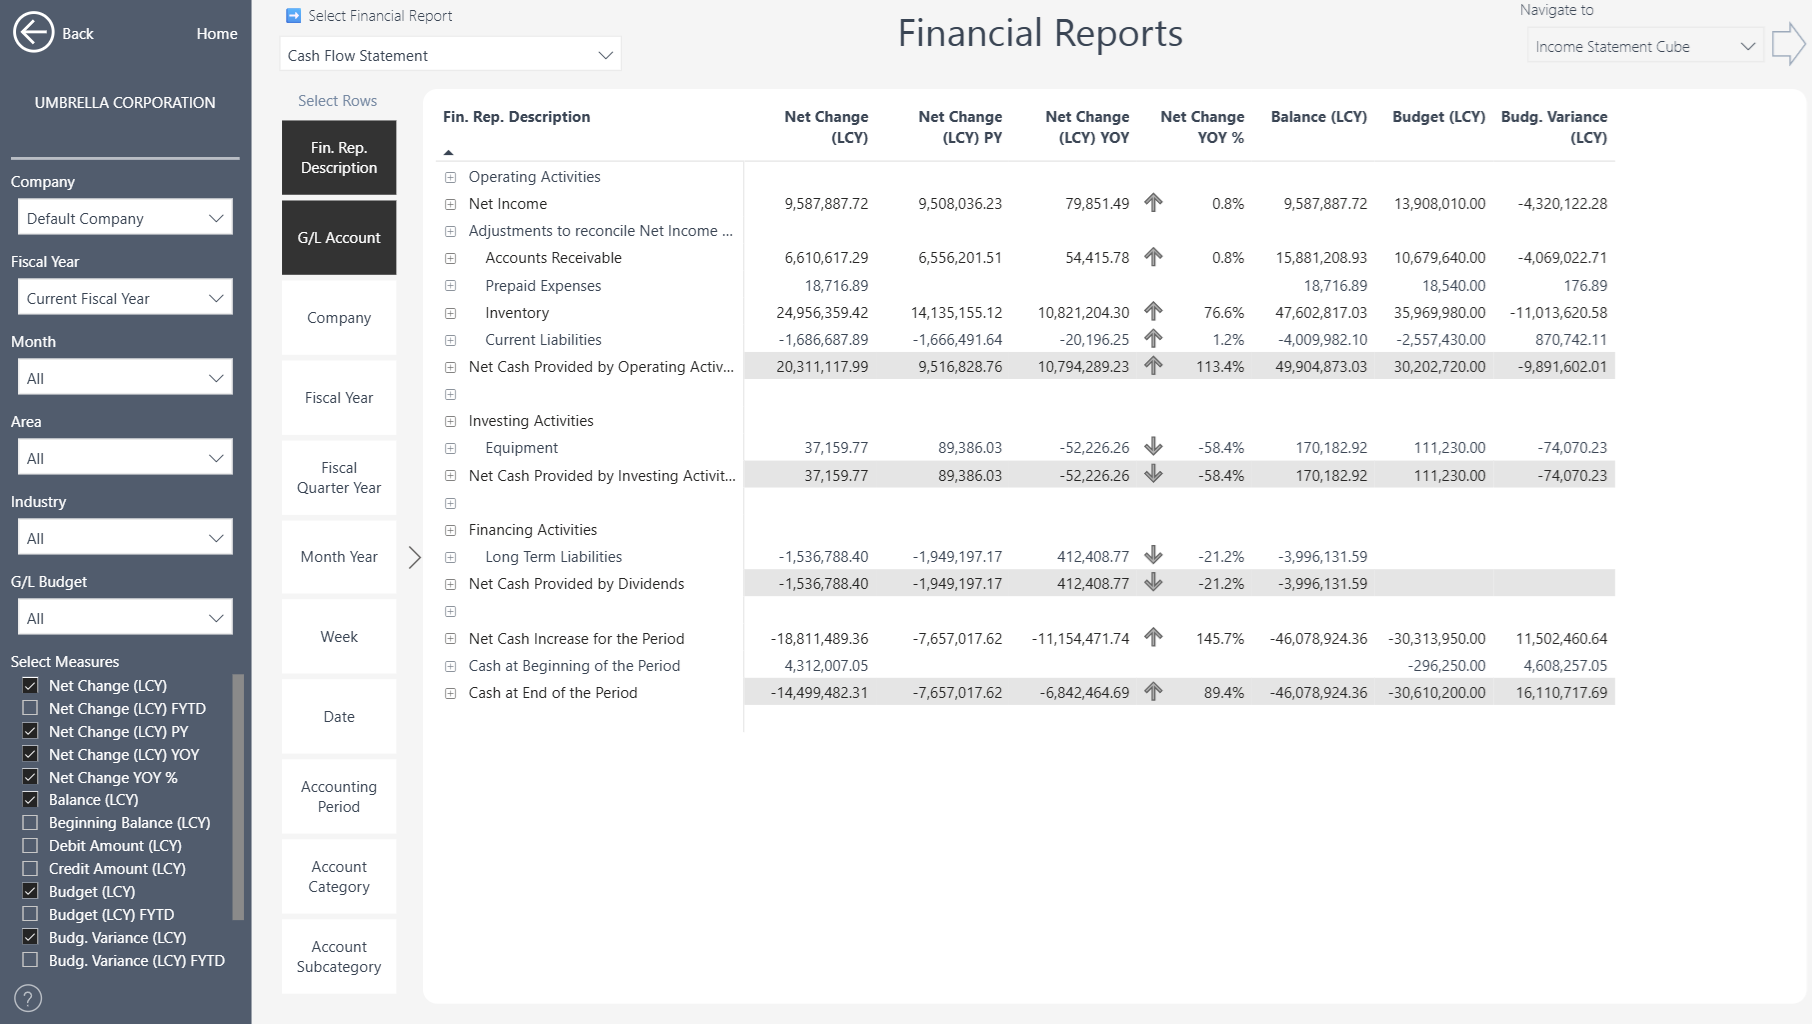
Cash Flow Statement by Month
What features are supported in Power BI?
The following features are currently supported in Power BI:
Row Definitions in Power BI
Our Financial Reporting solution supports Row Definitions from Business Central. These are imported into Power BI and can then be visualized alongside standard financial measures.
Supported Totaling Types:
The totaling type determines which accounts will be totaled, that you specify in the Totaling field.
Posting Accounts – Select Posting G/L accounts in the Totaling field.
Total Accounts – Select End-Total and Total G/L Accounts in the Totaling field
Account Category – Select G/L Account Categories in the Totaling field.
Formula – Create custom rows based on logic or filters applied to existing rows. We currently support +, - and / operations and filter expressions (Note: the characters (, ), ^, % are not supported in Power BI).
Cash Flow Entry Accounts - Select Cash Flow Forecast Accounts in the Totaling field.
Cash Flow Total Accounts - Select Cash Flow Forecast Total Accounts in the Totaling field.
Statistical Account – Include non-financial metrics like employees or units sold to calculate ratios and performance KPIs.
Supported Amount Types:
Amount Type = Net Amount – shows the net balance of the account(s) for the period, after debits and credits are applied.
Supported Dimension Totaling / Filters
In Business Central Financial Reporting you can apply additional Dimension filters (or totaling) to each line. In this example NT, SA and QLD areas were chosen to include all dimensions in this range.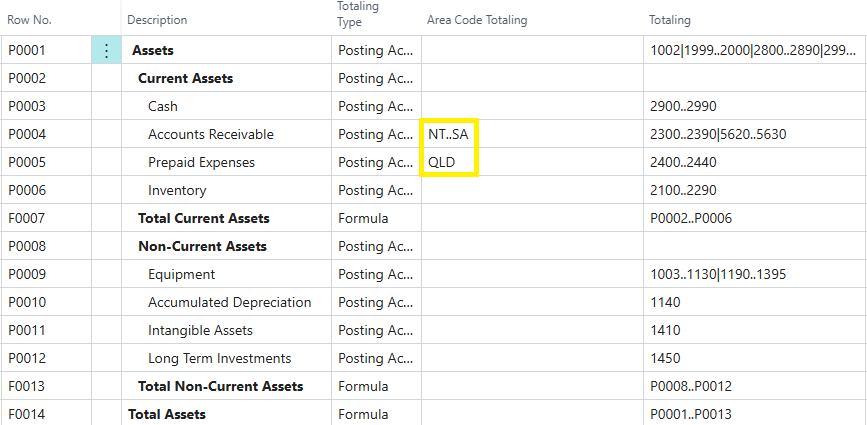
We support all 4 additional dimension filters in Power BI.
Dimension filters will be automatically applied in Power BI.
Applying Additional Dimensions in Business Central Financial Reports
In Microsoft Dynamics 365 Business Central, you can apply two Global Dimensions to your financial reports.
If you need to filter row definitions using more than two dimensions, you have two main options:
Option 1: Use Analysis Views (Standard Approach)
To include additional dimensions beyond the two Global Dimensions, you can create an Analysis View.
An Analysis View serves as a new data source for your financial reports and allows you to combine multiple dimensions for deeper insights.
For more details on how to set up and use Analysis Views, refer to Microsoft’s official documentation:
Combine Dimensions in Financial Reports – Business Central
Option 2: Apply Power BI Dimensions
An alternative method to extend your analysis with additional dimensions is by using the “Apply Power BI Dimensions” feature on the Financial Report – Row Definitions page.
.png)
When this option is enabled:
The Row Definition Dimensions defined in Business Central will be overwritten by the dimensions you have selected in the Dimension Setup page of the Power BI Insights Connector.
You can learn more about this setup here: Power BI Insights Connector – Dimension Setup
Example
In the example below:
Dimension 3 = Project
Dimension 4 = Sector
.png)
Once these dimensions are selected in Power BI Insights Connector, they will automatically appear in your Row Definitions within Business Central..png)
This allows you to filter your financial reports by Project and Sector directly in Power BI, without the need to create Analysis Views.
Important Note: When you Apply Power BI Dimensions the additional dimensions (Dimension 3 and 4) are applied only in Power BI, not in Business Central.
Therefore:
When viewing reports in Power BI, filters for Dimension 3 and 4 will be applied.
When viewing reports directly in Business Central, filters for Dimension 3 and 4 will not be applied.
You can analyze your financial reports in Power BI by any dimension. Our Power BI apps support all 12 Financial Dimensions, which are configured in the Power BI Insights Connector. https://businesscentralinsights.com/dimension-setup
Together, these options let you build reports that range from detailed transactional breakdowns to high-level financial summaries, depending on what your business needs to see.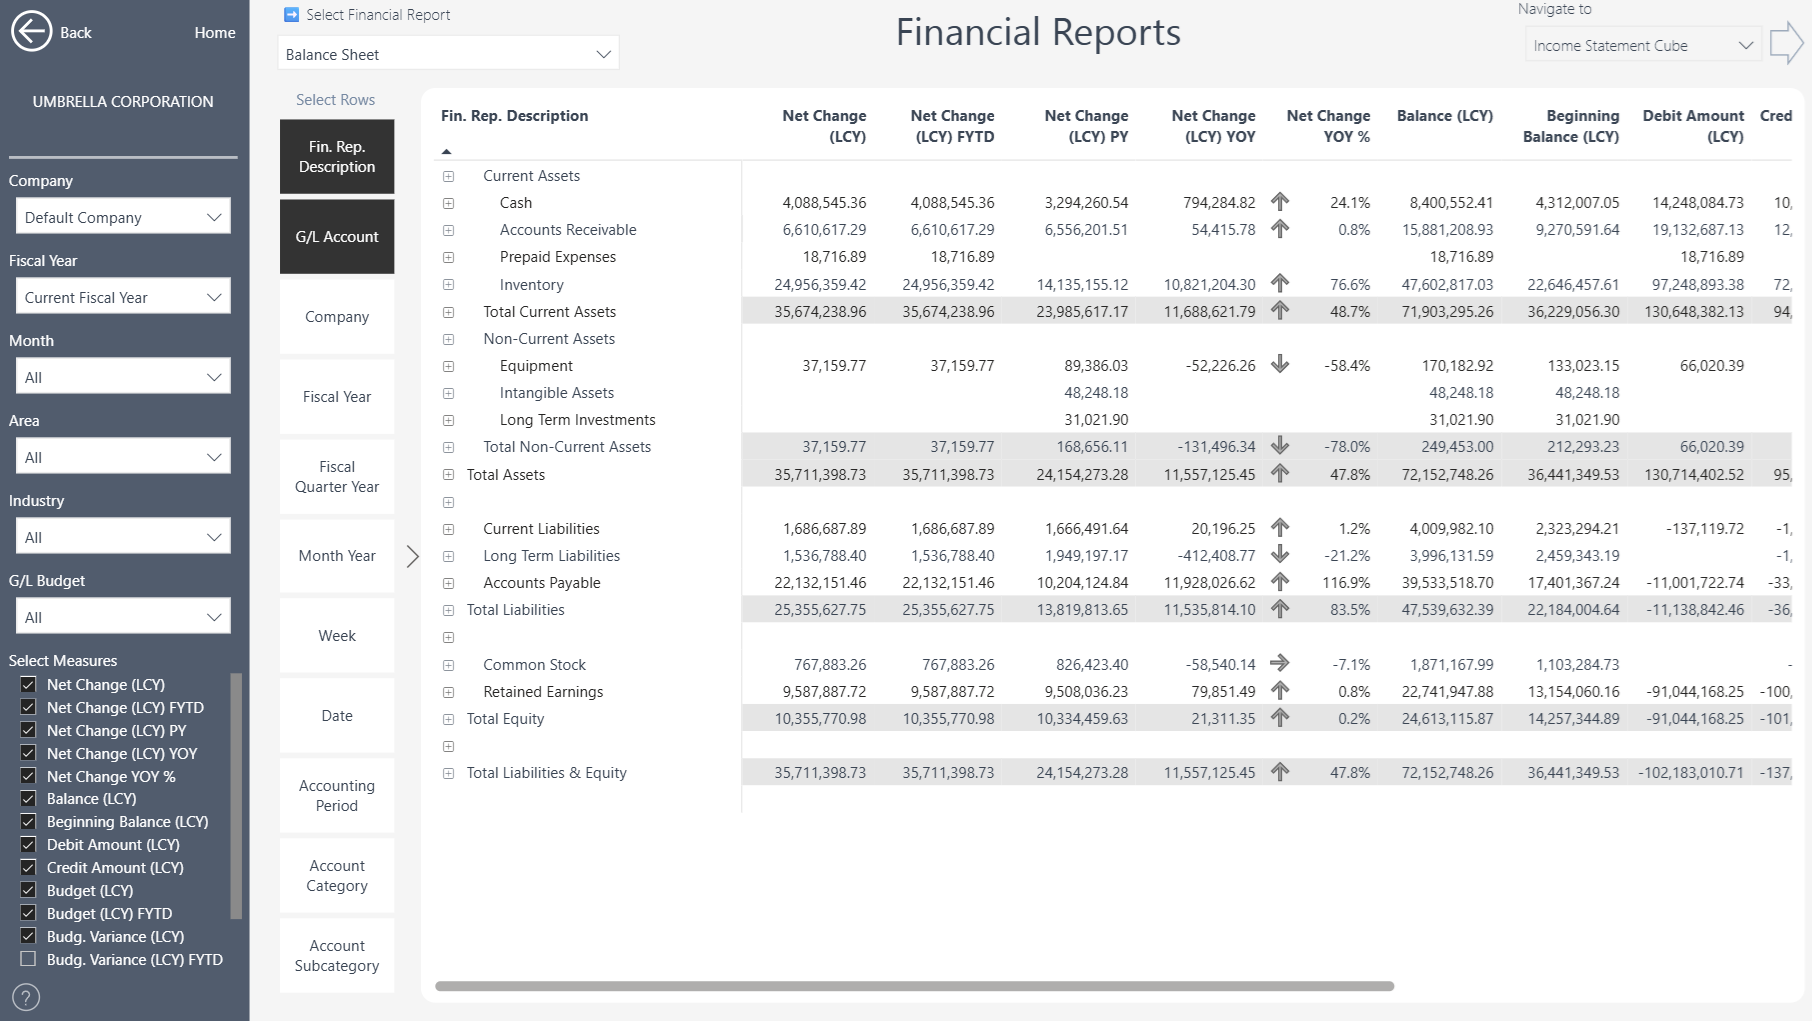
Column Definitions and Measures
While column definitions exist in standard Business Central, in Power BI they are represented through measure selection. Instead of pre-defined columns, you can dynamically choose which financial measures to display in your report.
This approach leverages the standard measures already available in Power BI, as shown in the example below where selected measures appear as the columns in the report.
How to create Financial Reports in Business Central
More information about Financial Reporting in Business Central can be found in the Microsoft Learn documentation.
Business Central Insights builds on these capabilities to make financial reporting more accessible and interactive within Power BI.
Example: Create a new Expenses Financial Report in Business Central
We are looking to create a straightforward financial report that displays expenses by different groups. Using our standard Income Statement as a foundation, we can easily adapt and customize it to meet specific reporting requirements.
Step 1: Create new Row Definition
Choose the search 🔎icon, enter (Financial Report) Row Definitions.
You can either create a new one, or, as shown in our example, copy an existing Row Definition.
Select Row Definition (copy an existing one, e.g. M-INCOME): choose copy Row Definition then enter ‘EXPENSES’ in the New Row Definition Name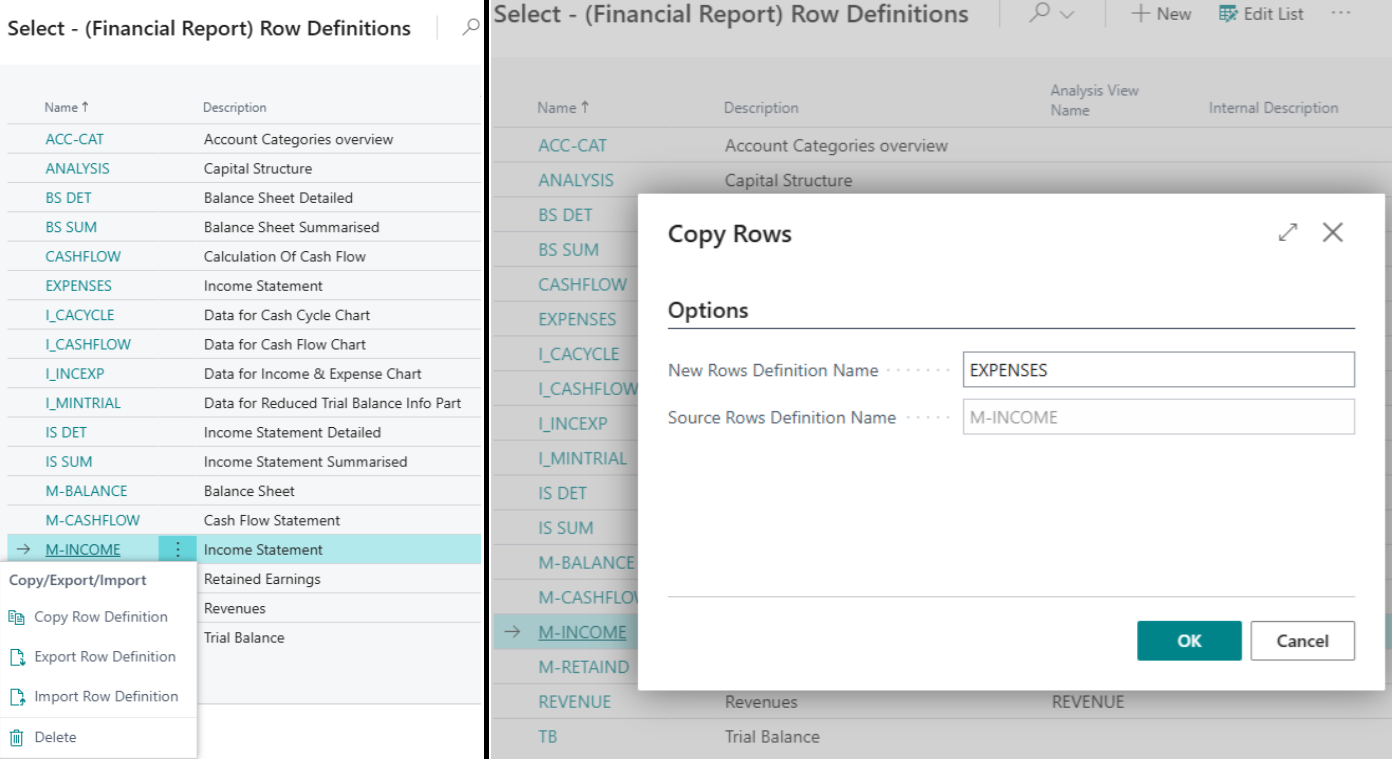
Step 2: Edit Row Definition
Home > Edit Row Definition 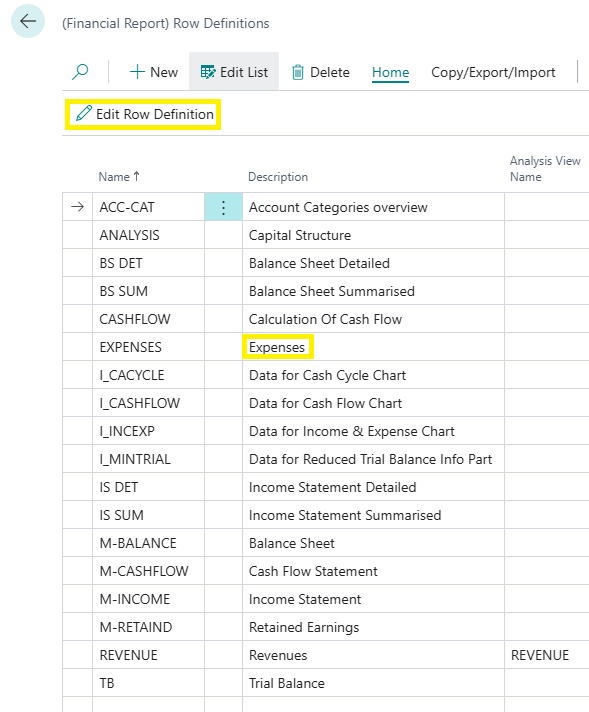
On this screen you can remove all irrelevant lines, in our example anything that was not expenses was removed, as well as all lines where the totaling is blank.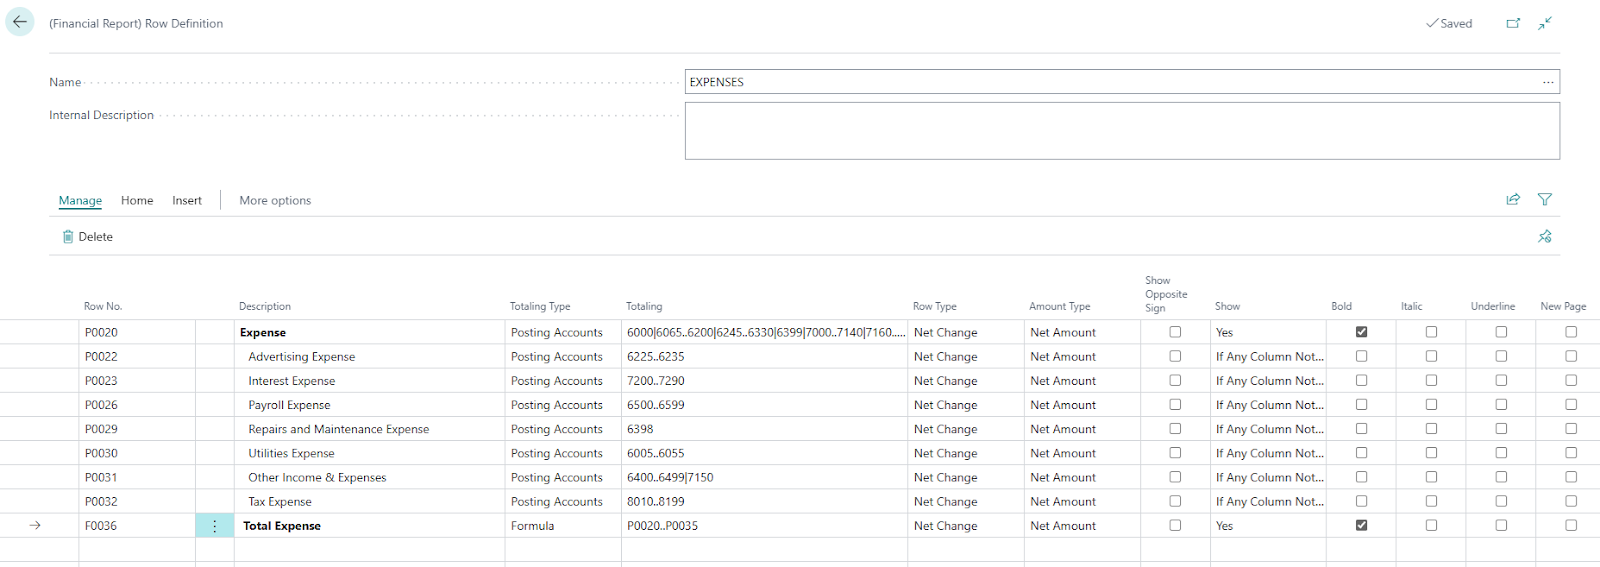
Step 3: Create Financial Report
Now that the row definition is set up, we can create a new financial report by following these steps:
Finance > Financial Reporting > + New > Type Name (e.g. ‘EXPENSES’) > Type Display Title (e.g. ‘Expenses Analysis’) > Select Row Definition drop-down: EXPENSES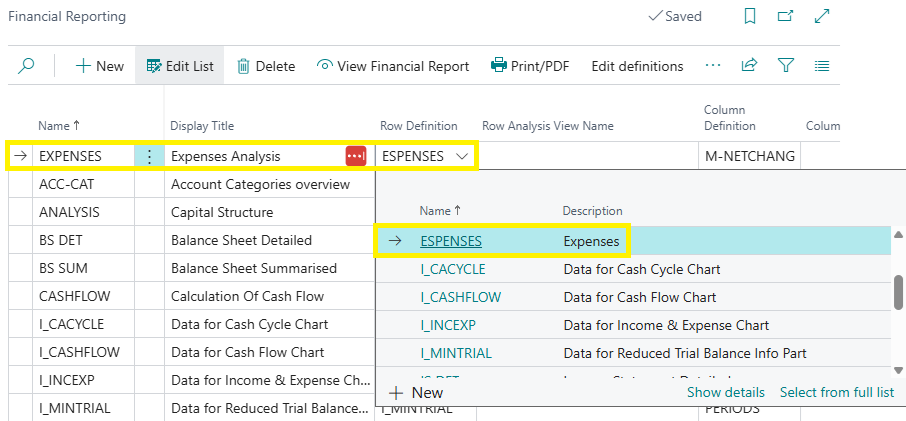
Then in the Column Definition drop-down: M.NETCHANG and choose View Financial Report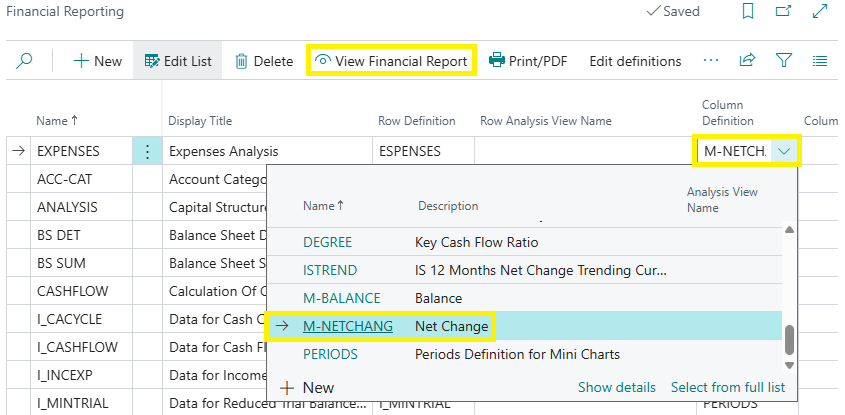
Step 4: View the Financial Report in Business Central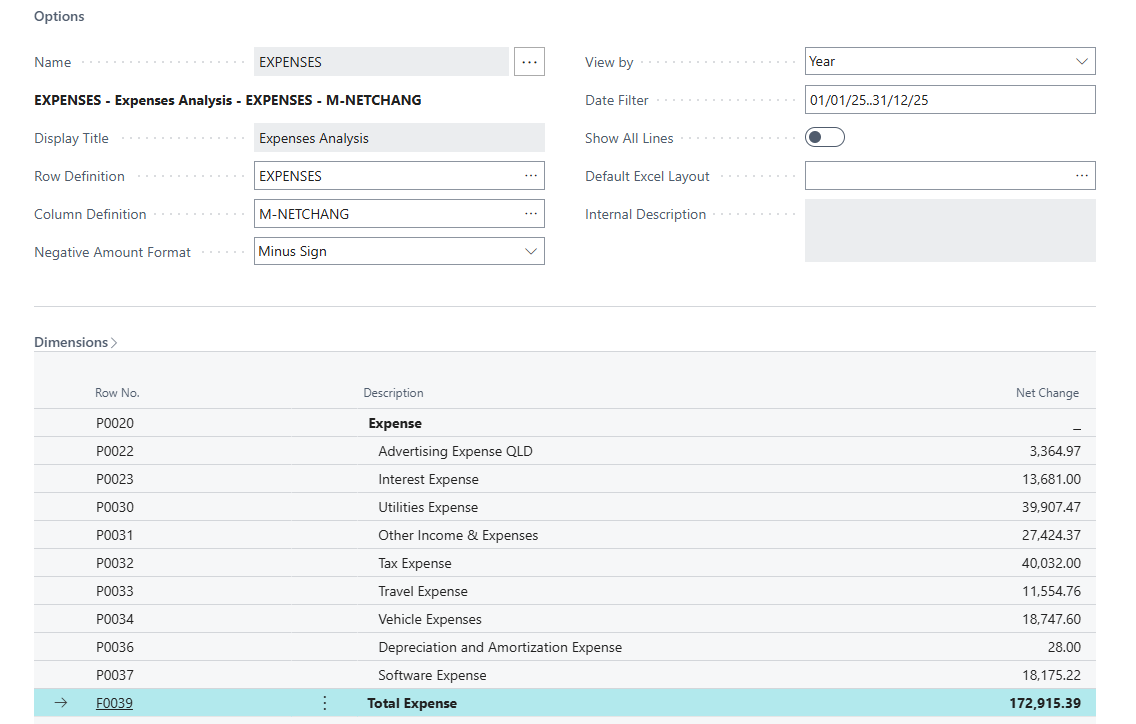
Step 5: Refresh the Semantic Model and view in Power BI
In Power BI, refresh your semantic model. You can do this manually from your workspace, or rely on your scheduled refresh from Business Central. Once refreshed, your new report will be available in Power BI, ready for filtering and analysis.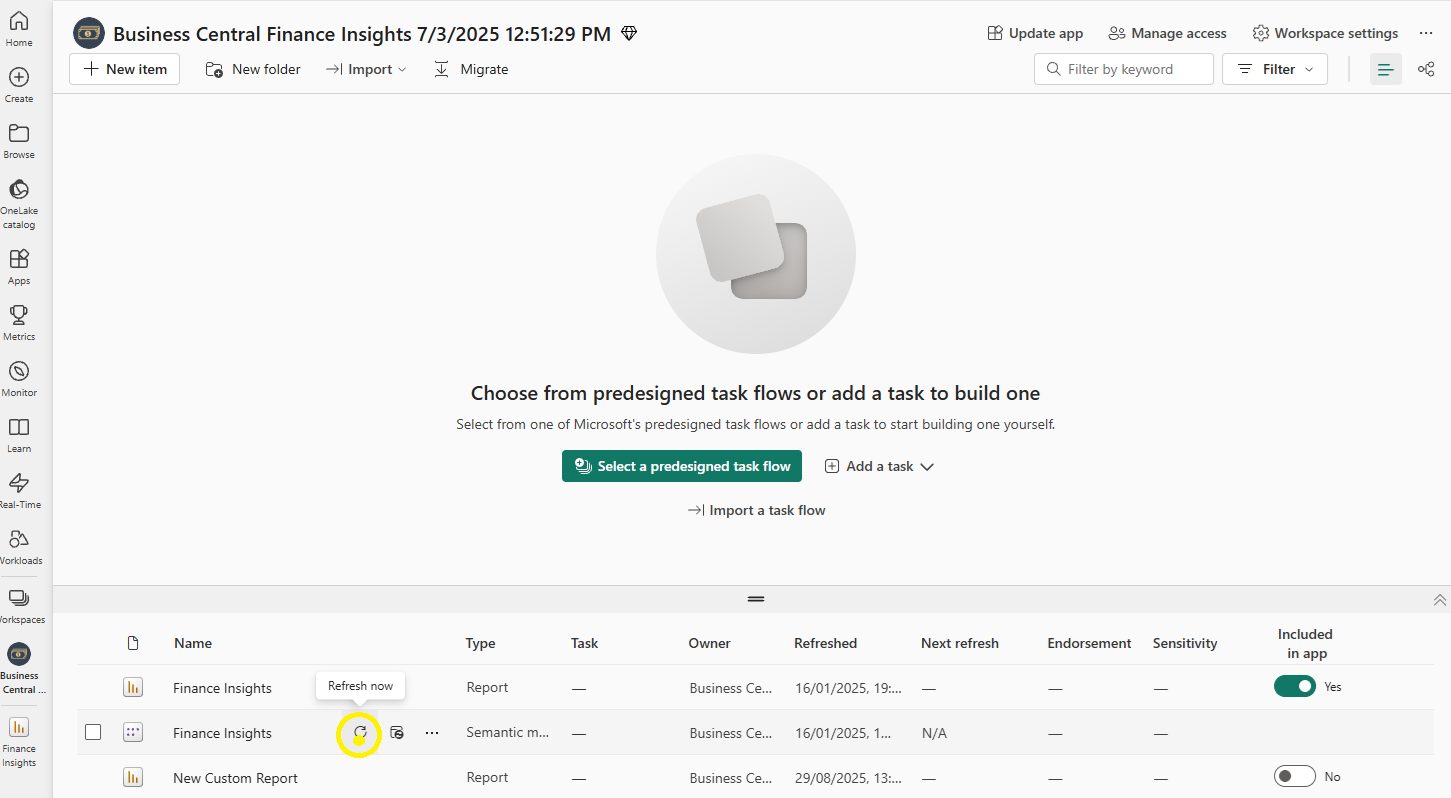
Then you can view your expenses by Month: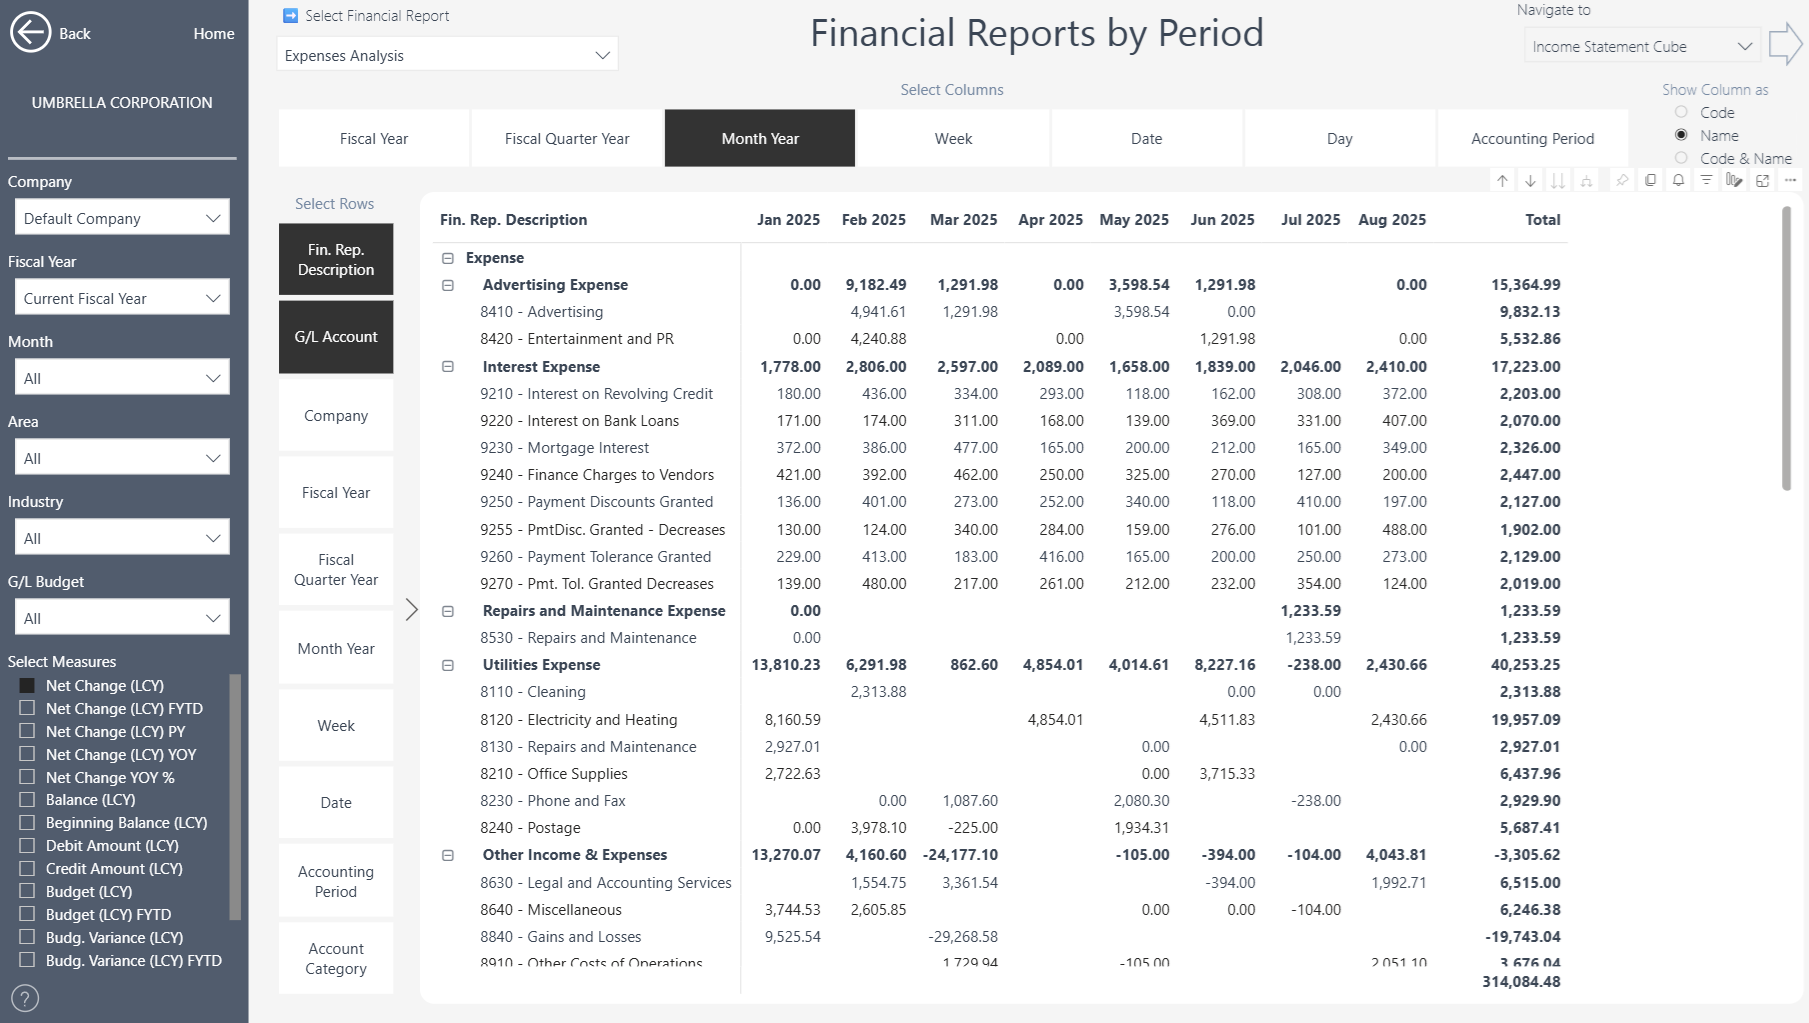
Or view expenses by Department or any other Dimension by selecting the tab in the column list.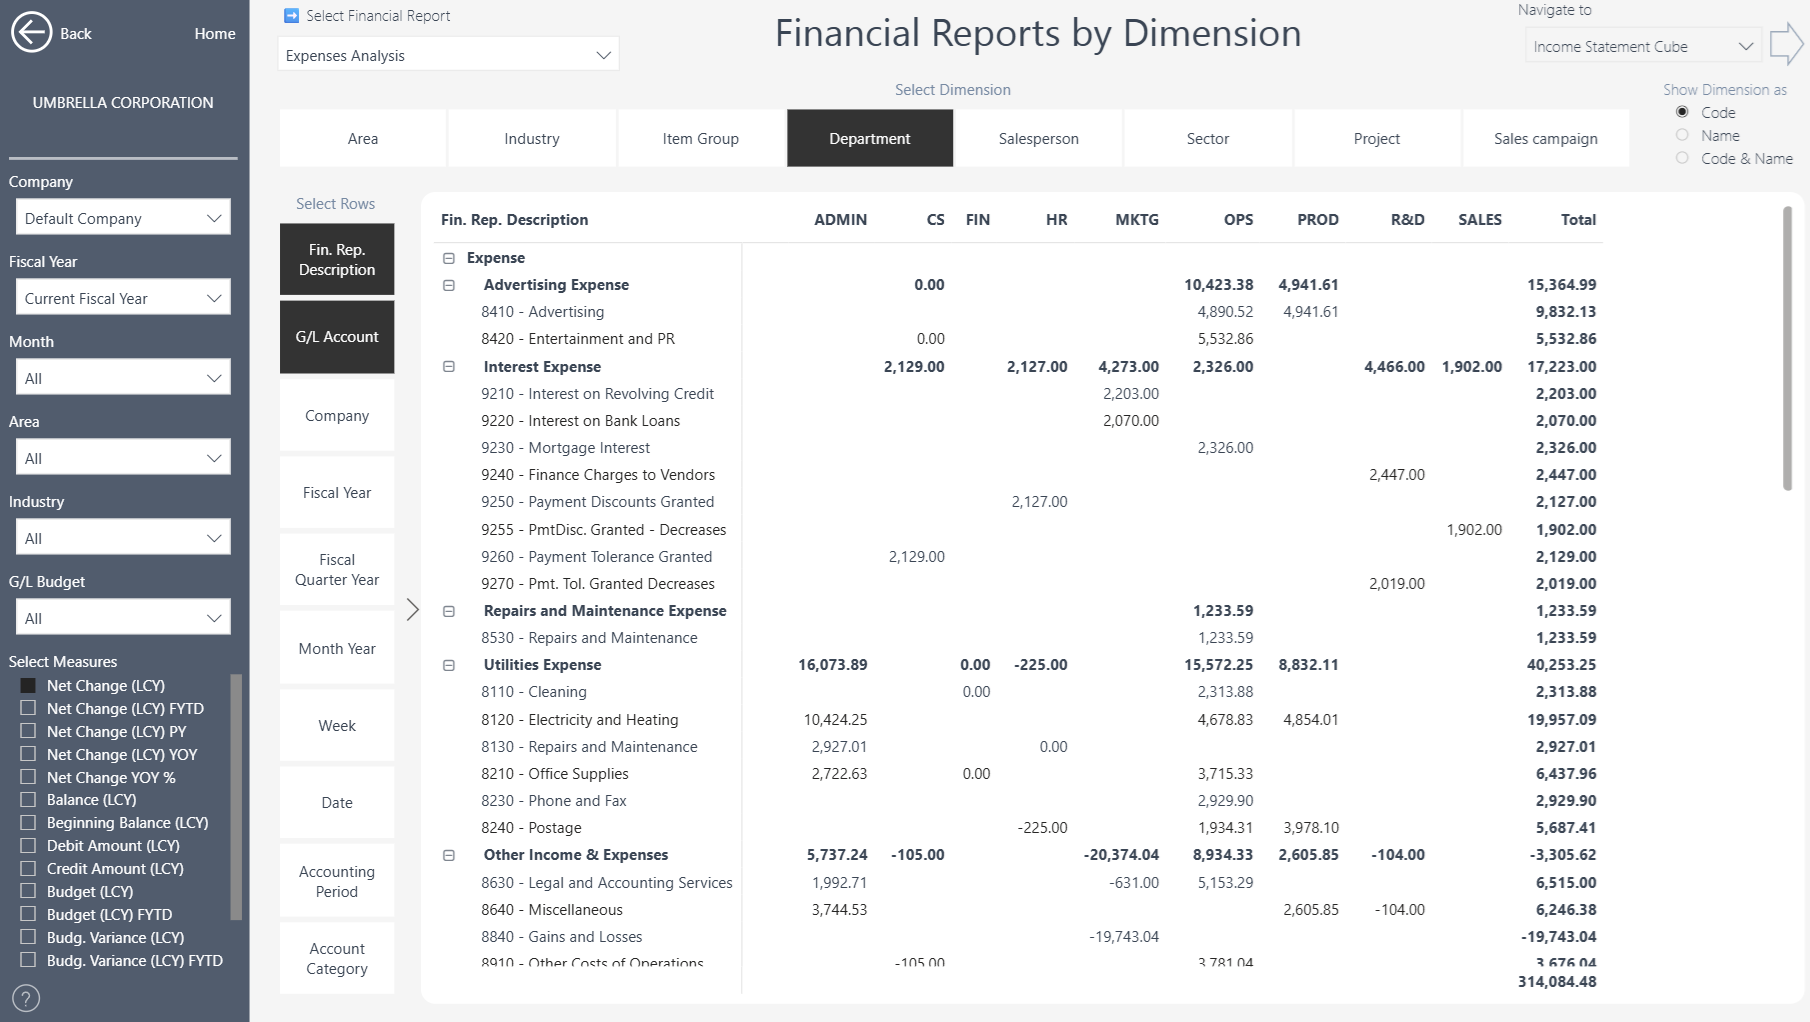
Once imported into Power BI, Financial Reports can be analyzed by:
Time – view reports over months, quarters, or years.
Dimensions – filter or group by whichever values your organization has configured (e.g. Department, Salesperson, Region, Project).
This means the same structures defined in Business Central can be analyzed dynamically in Power BI, transforming static financial statements into interactive reports that can be drilled into, filtered, and reused across the organization.
Note: Each time you change the Financial Reports definition in Business Central, you will have to refresh the semantic model in Power BI to reflect the changes.
Excluding Reports from Power BI
A new field, “Exclude from Power BI”, has been added to the Financial Report screen in Business Central. By selecting this field, you can prevent specific reports from being imported and displayed in Power BI.
This is useful for test or draft reports that should remain internal to Business Central only.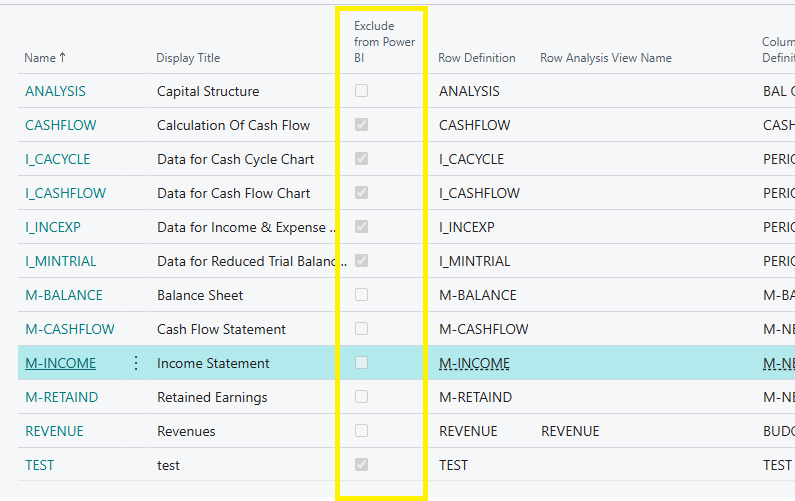
Analyze Financial Reports in Excel
You can now recreate the same Financial Reports directly in Excel using a live connection to your Business Central Insights dataset. Add filters such as Company Name, Fiscal Year, and Financial Report Description to switch between reports instantly, just like in Power BI.
When building your PivotTable, make sure to select measures only from the Financial Reporting folder (identified by the Fin. prefix) to ensure all calculations match the definitions used in Power BI.
Use the Indented Description field in the Rows area to align your layout with totals and hierarchies, keeping your structure identical to the financial reports in Business Central. From there, you can add measures to the Values area to display them, or drag Dimensions into Columns to view results by area, department, or project.
For a full step-by-step walkthrough of setting up and analyzing these reports in Excel, watch the tutorial video above.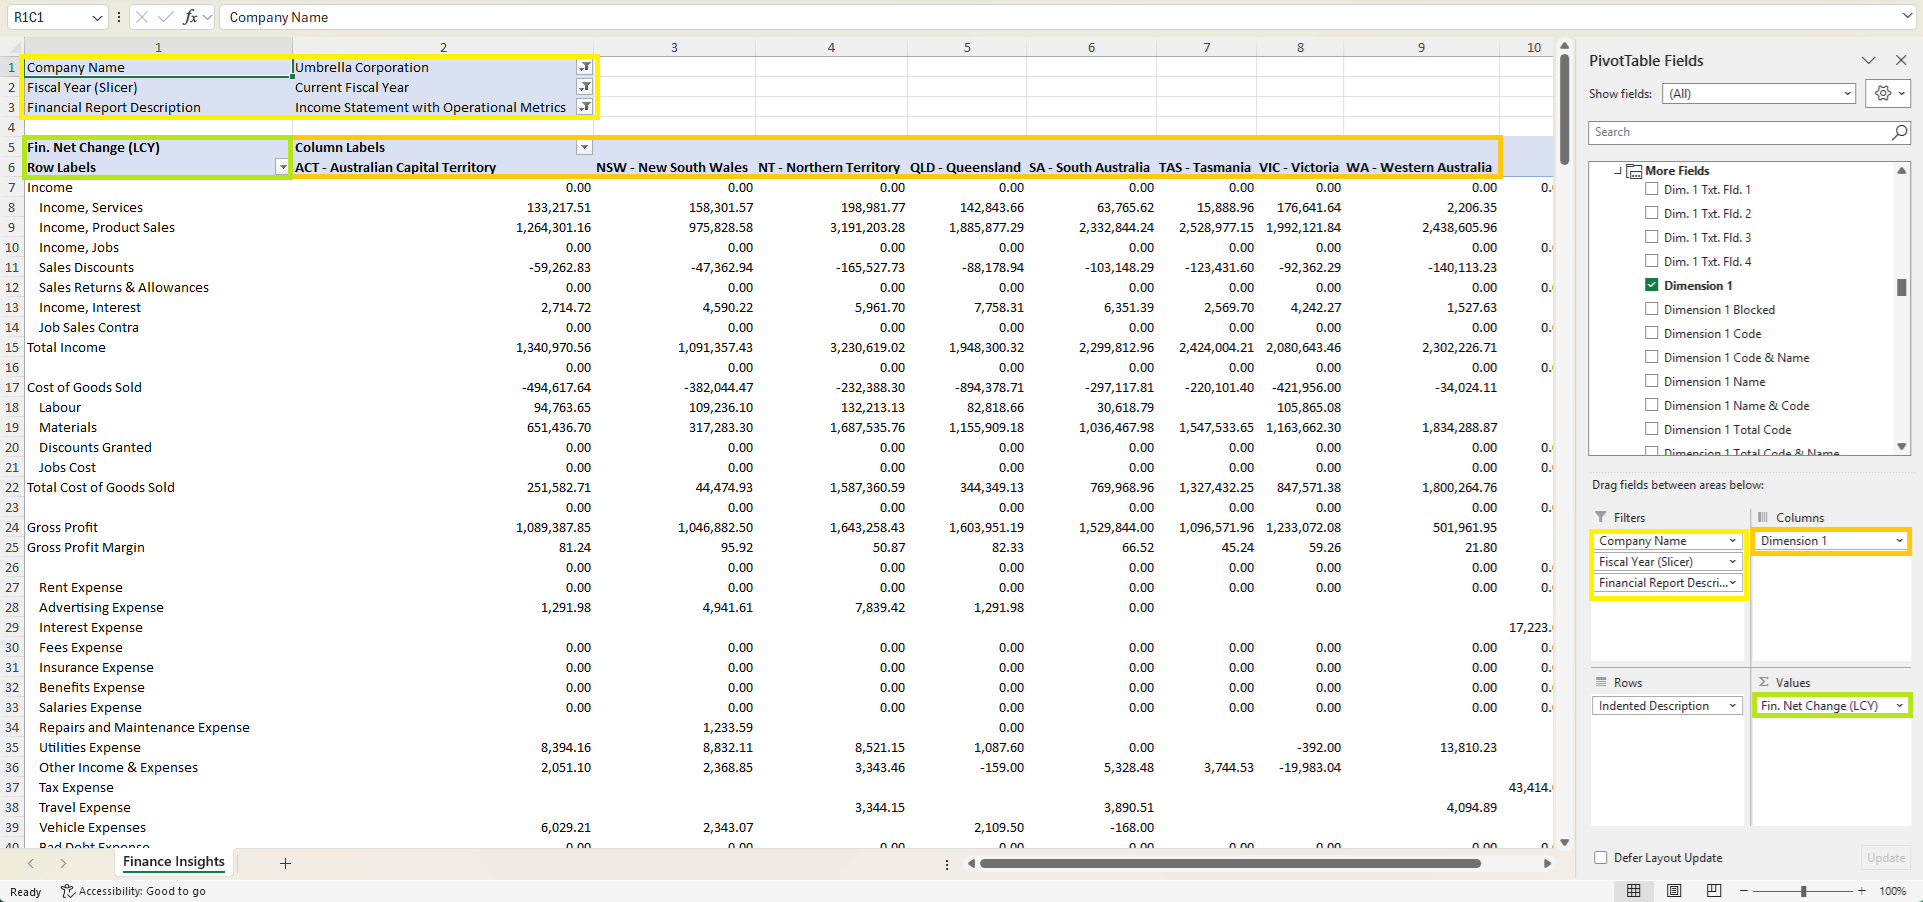 For more in-depth guidance on creating and managing financial reports, explore Microsoft’s official training: Create financial reports in Microsoft Dynamics 365 Business Central.