Power BI Scorecards with Business Central Insights

Power BI Scorecards with Business Central Insights
Power BI Scorecards turn reporting into performance management.
If you are already using Microsoft Dynamics 365 Business Central together with Business Central Insights, you likely have strong visibility into your business through dashboards and reports. However, visibility alone does not drive performance.
Leadership teams need to understand:
• Are we on track against our targets?
• Who owns each objective?
• Where are we at risk?
• What actions should be taken when performance changes?
Power BI Scorecards provide a structured way to answer these questions by connecting live metrics to clearly defined goals.
What You Will Learn
In this guide you will learn how to:
• Create a Power BI scorecard to track business performance
• Add goals linked to Business Central Insights metrics
• Connect goals to cube measures such as sales, profitability, and operational KPIs
• Monitor performance using automatic status indicators and KPI tracking
What Power BI Scorecards Enable
Scorecards extend traditional reporting by introducing goal tracking and structured performance monitoring.
Key capabilities include:
Automated KPI tracking
Goals can connect directly to Power BI visuals and measures, meaning targets update automatically whenever the underlying dataset refreshes.
Performance status indicators
Status rules visually indicate whether a goal is on track, at risk, or behind, allowing leaders to quickly understand performance at a glance.
Ownership and accountability
Each goal can have an assigned owner responsible for monitoring progress and updating check-ins.
Check-ins and collaboration
Teams can leave updates and notes directly within a goal, creating useful context around performance changes.
Alerts and automation
Scorecards integrate with Power Automate and subscriptions to notify stakeholders when metrics change or targets are missed.
Together, these features move organisations from reactive reporting to proactive performance management.
Using Scorecards with Business Central Insights
Business Central Insights provides the metrics that feed scorecards.
Because BCI reports expose hundreds of financial and operational measures within Power BI, organisations can easily connect goals to live Business Central data such as:
• Gross Profit
• Gross Profit Margin
• Sales vs Budget
• Inventory Turnover
• On-Time Delivery
• Cash conversion metrics
Once connected, scorecards automatically update as the Business Central Insights semantic model refreshes, ensuring leadership always sees the most current performance.
This creates a clear performance workflow:
Business Central → Business Central Insights → Power BI Metrics → Scorecards → Organisational Action
In the next section, we walk through how to create a scorecard and connect goals using metrics from Business Central Insights cubes.
Creating a Scorecard and Tracking Goals from Cubes
Power BI Scorecards allow you to track important KPIs from your Business Central Insights reports in one place.
A scorecard contains multiple goals, with each goal tracking a specific metric such as sales performance, inventory levels, or operational KPIs.
Metrics can be connected directly from reports, tables, or cubes, giving you access to hundreds of predefined measures without needing to create custom calculations.
This guide explains how to create a scorecard and connect a goal using a metric from a cube.
Step 1: Create a Scorecard
Before adding goals, you first need to create a scorecard.
Open Power BI Service.
Navigate to Scorecards.
Click New Scorecard.
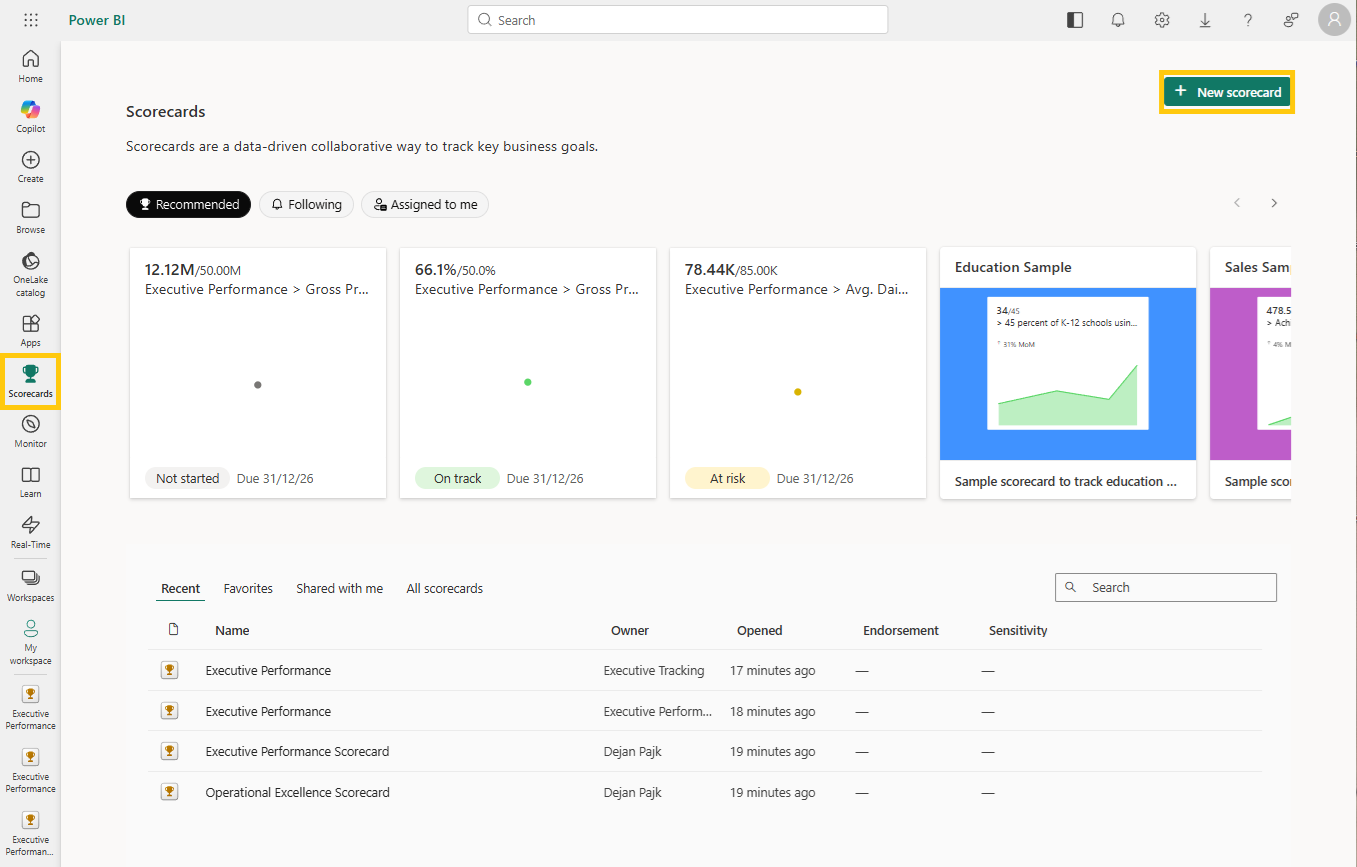
Enter a name for the scorecard (for example Executive Performance or Operational Excellence).
Click enter.
 Your scorecard is now ready to track goals.
Step 2: Add a Goal
Goals represent the KPIs you want to track.
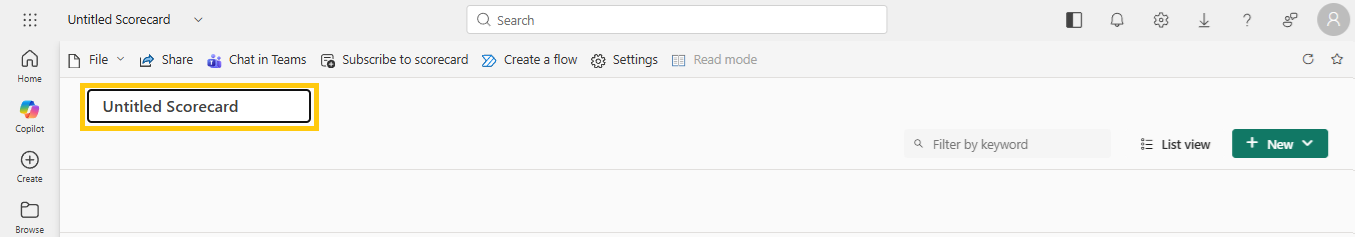
Open the scorecard you created.
Your fist goal will be empty and ready to populate, for additional goals: In the top right click New > New Goal from the dropdown
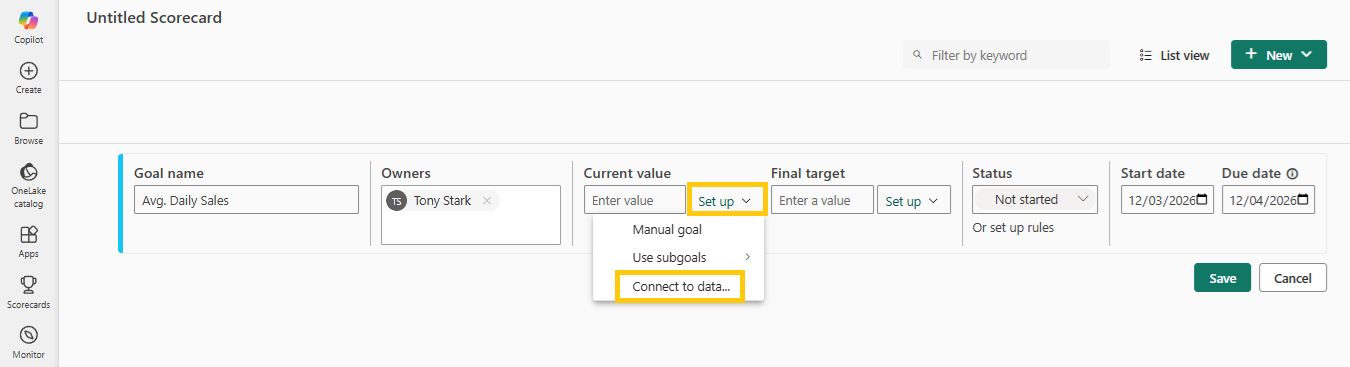
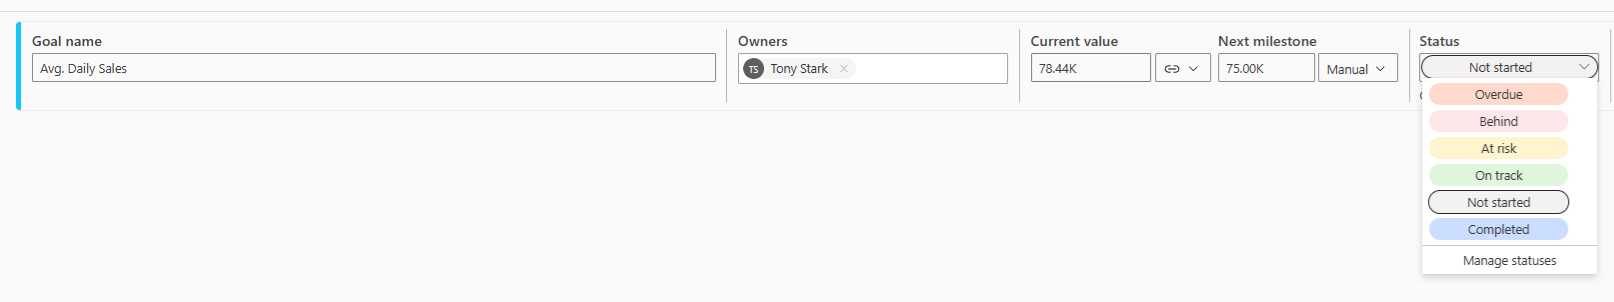
Enter the Goal name of the metric you want to track (for example Avg. Daily Sales).
Add the Owners (for example Tony Stark).
In the Current Value field, open the Set up dropdown and select Connect to Data.
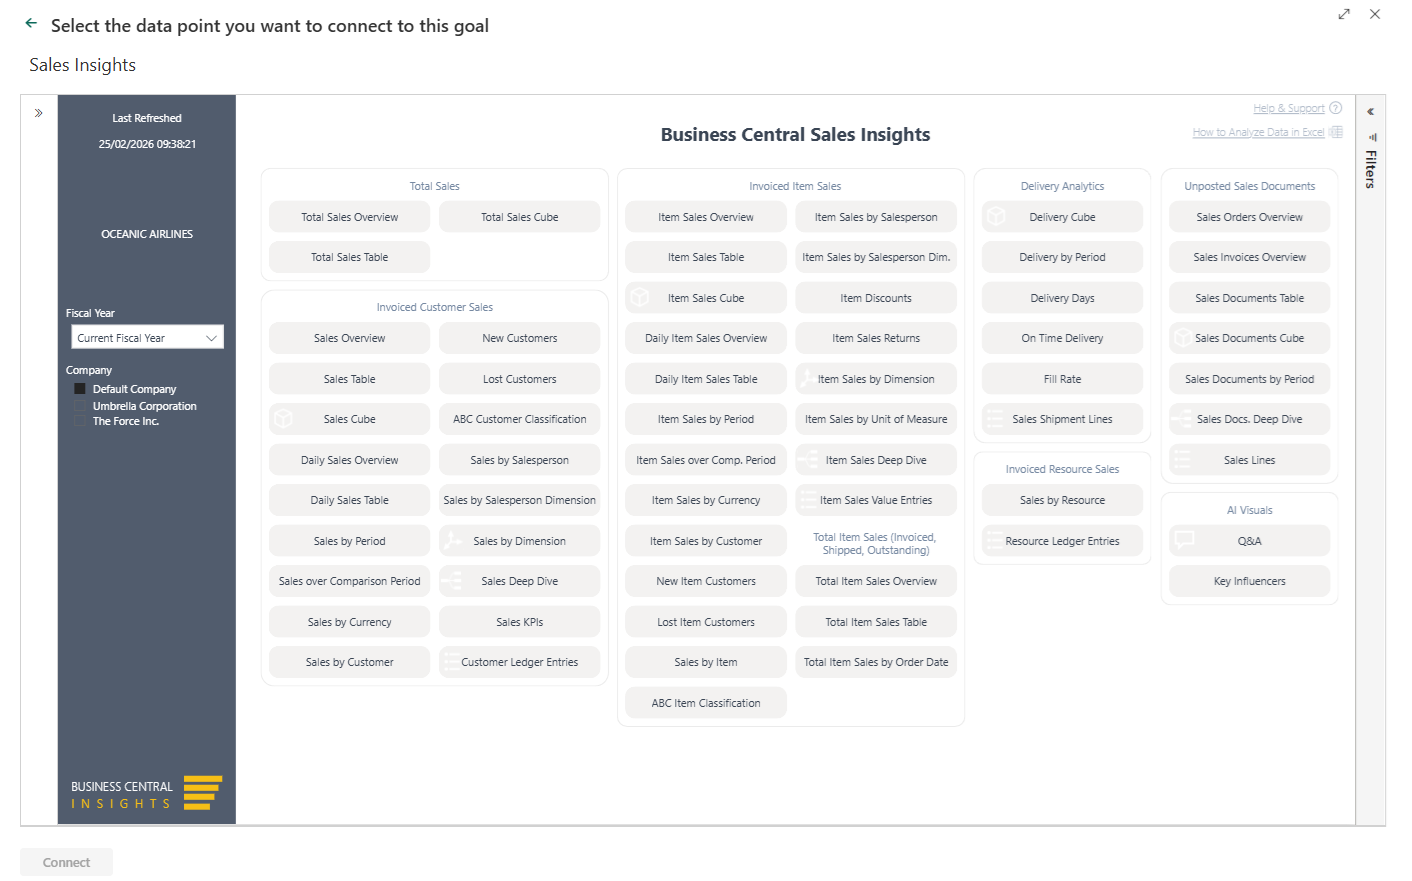
This opens the data source selector where you can choose which Business Central Insights app the metric will come from and then click Next
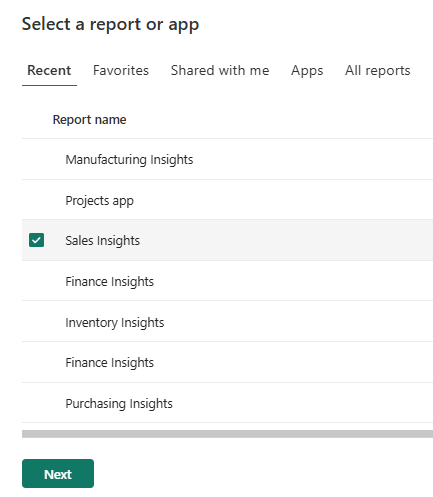 You now have all the reports within the chosen app to use as data sources
 Step 3: Connect to a Cube report Metric
To use a cube metric:
Select the Cube as the data source.
Choose the relevant cube (for example Sales Cube, Item Sales Cube, or Delivery Cube).
Each cube contains many predefined business measures that can be used as goals.
Step 4: Select the Metric
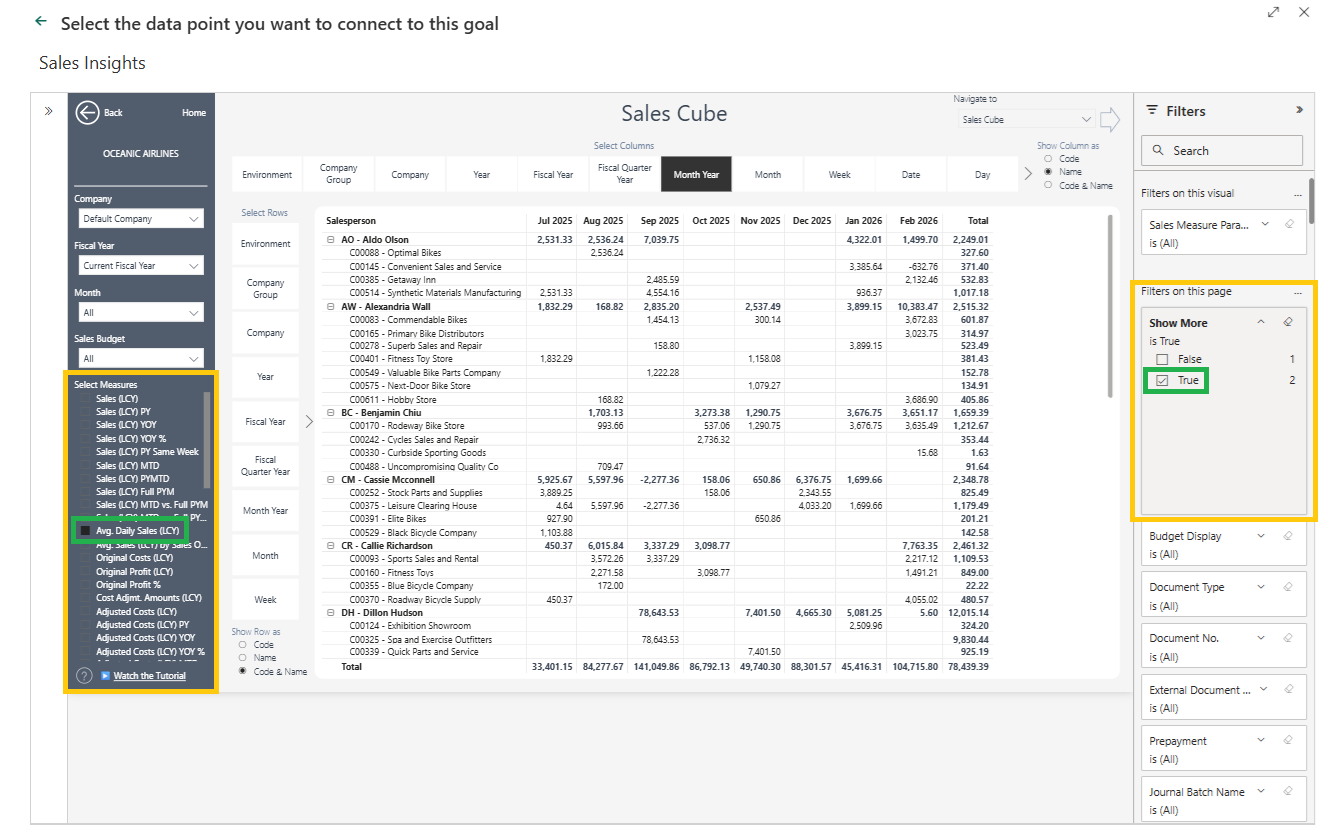
After opening the cube, the Measure Selection panel is on the left side.
Locate the metric you want to track.
Select the measure (for example Average Daily Sales).
The report will reconfigure the visual to that measure.
If you want to see all available measures:
Locate the Show more filter on the right side of the page.
Set Show more = True.
This reveals the full catalogue of measures available in the cube.
 Step 5: Confirm Filters and Connect the Goal
After selecting the measure:
Click the visual containing the metric. Make sure to click empty space within the visual, otherwise you may select a specific data point, which will apply a filter to that value rather than using the overall report filter.
Importantly, in the pop-up window confirm that the filters applied to the measure are correct.
Typical filters include:
• Company Name (default company)
• Fiscal Year (for example Current Fiscal Year)
Technical filters such as parameter fields can generally be ignored.
Once confirmed, click Connect Data.
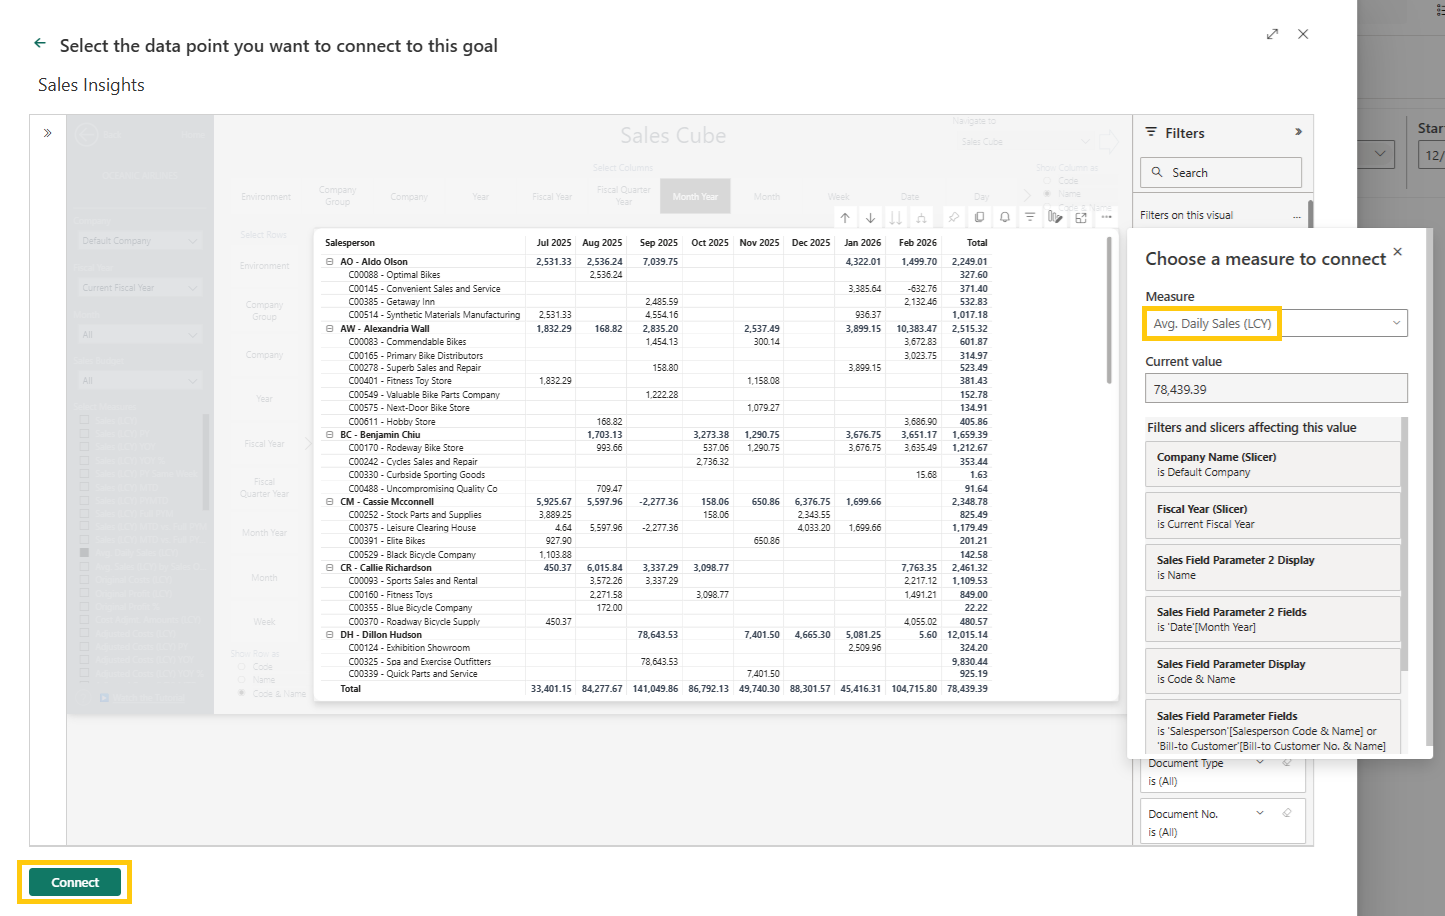 The metric will now be added to your scorecard as a goal and its value will update automatically as the data refreshes.
Note: If the metric is selected from a report visual rather than a cube, the pop-up will display a dropdown containing the measures used in that visual. From there, you can choose the specific measure you want to track as the goal.
Step 6: Set the Target Value
Once the Current Value has been connected, you can define the target for the goal.
Targets allow Power BI to determine whether the metric is performing as expected.
You can set the target in two ways:
• Manual Target
Enter a fixed value directly in the Target field. This is useful when the KPI has a static target that does not change frequently.
• Connect to Data
Alternatively, you can connect the target to a Power BI measure, such as a budget or forecast metric.
To do this:
• Open the Target dropdown.
• Select Connect to Data.
• Choose the relevant report, visual, and measure using the same process used when connecting the current value.
Note: Using a measure-based target ensures the goal automatically updates whenever the underlying dataset refreshes.
Step 7: Configure the Status Indicator
Power BI Scorecards use status indicators to show how performance compares to the target.
To configure the status:
• Open the Status dropdown.
 • Choose a status calculation method.
Common status indicators include:
• On Track
• At Risk
• Behind
You can customise how these statuses are calculated by selecting Or set up rules.
 This allows you to define thresholds such as:
• On track when performance is within a certain percentage of the target
• At risk when performance falls slightly below the target
• Behind when performance significantly misses the target
These rules allow organisations to define KPI thresholds that align with their own reporting standards.
Step 8: Set the Timeline
Each goal can include a timeline that defines when the target should be achieved.
Configure the following fields:
• Start Date – when tracking begins
• Due Date – when the goal should be achieved
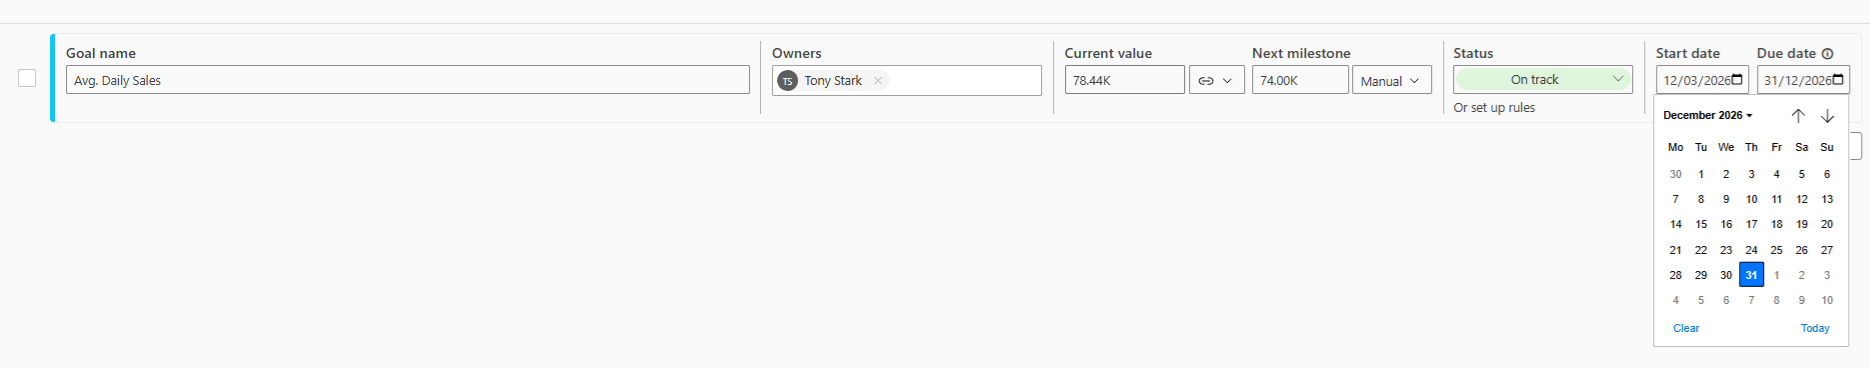 These dates help Power BI evaluate whether the goal is progressing as expected within the defined timeframe.
Step 9: Finalise the Goal
As the Business Central Insights dataset refreshes, Power BI will automatically update the metric and recalculate the status. This provides a live view of performance against the defined target, helping teams monitor progress and respond quickly when performance changes.
Key benefit: Combining goals across the business
Once your first goal is created, you can continue adding multiple goals to the same scorecard, each connected to different reports, cubes, and business areas. This allows a single scorecard to bring together KPIs from across the organisation.
For example, a leadership scorecard might include:
• Finance metrics such as Gross Profit or Cash Flow
• Sales metrics such as Avg. Daily Sales or Sales vs Budget
• Operations metrics such as On-Time Delivery or Order Lead Time
• Inventory metrics such as Inventory Turnover or Stock Coverage
By combining these goals into one scorecard, teams can see how performance across departments connects to overall business objectives.
This approach is particularly valuable for leadership teams because it provides a single, structured view of organisational performance rather than reviewing separate reports for each department. Each goal can still have its own owner, target, and status rules, ensuring accountability while keeping all key metrics aligned in one place.
Missing a Metric?
If a specific metric is not currently available in the cube, let us know. We continuously expand the available measures and may include additional KPIs in future releases.
Microsoft Learning Resources
To learn more about Power BI scorecards and goals, Microsoft provides detailed documentation and learning resources.
Microsoft Learn
https://learn.microsoft.com/en-us/power-bi/create-reports/service-goals-introduction
Power BI Scorecards overview
https://learn.microsoft.com/en-us/power-bi/create-reports/service-goals-create
These resources explain how to create goals, configure status rules, manage permissions, and integrate scorecards into your Power BI environment.