Delivery Performance for Business Central

The Delivery Analytics reports in the Sales Insights app show how well you deliver against what you promise. Four reports cover the question from different angles:
Delivery Days – how long deliveries take, and how far they land from the committed date.
On-Time Delivery – what share of orders, order lines, shipments or quantity arrived on time.
Fill Rate – what share of orders, order lines or quantity you have shipped in full.
Delivery Cube and Delivery by Period – the same measures, arranged however you need them.
All four reports read the standard Business Central sales tables. Nothing has to be configured in Business Central beyond the delivery dates you already maintain on your sales lines.
Delivery Days
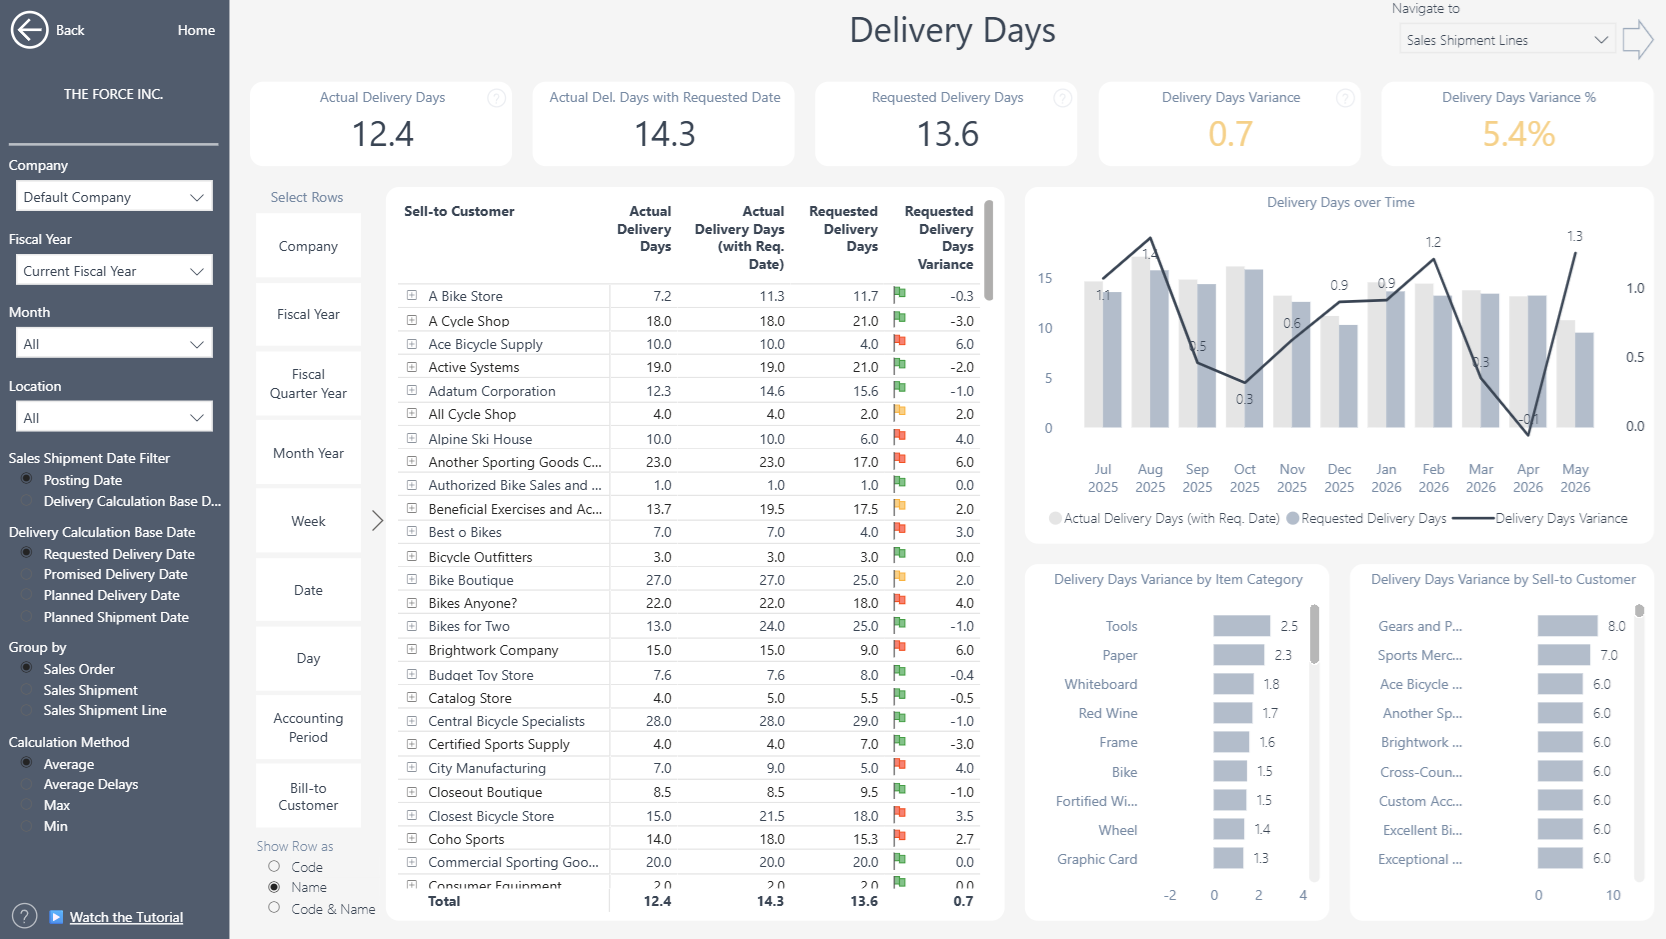 The Delivery Days report measures the time between taking an order and delivering it, and compares it with the time you committed to. It answers the questions "how long do we take?" and "how far off are we?" – by customer, item, location, dimension or period.
The Three numbers
For each posted sales shipment line the report calculates, in calendar days from the line's order date:
Measure | Counted from the order date to… |
|---|---|
Actual Delivery Days | the actual delivery date (the shipment's posting date plus the shipping time) |
Requested / Promised / Planned Delivery Days, Planned Shipment Days | the committed date you selected as the base date |
Variance | the difference: actual days minus committed days |
A positive variance means the delivery was late by that many days; a negative variance means it was early. Lines with a blank order date, or a blank committed date, are left out of the calculation rather than distorting it.
Delivery Calculation Base Date
A Business Central sales line can hold several commitment dates. Use the Delivery Calculation Base Date selection in the left-hand menu to choose the one that reflects your sales process: Requested Delivery Date, Promised Delivery Date, Planned Delivery Date or Planned Shipment Date. The committed-days and variance measures recalculate against your choice.
Grouping and calculation method
Group by – Sales Order, Sales Shipment (the default) or Sales Shipment Line. This decides what one "delivery" is when days are averaged: an order may be delivered in several shipments, and a shipment may contain several lines.
Calculation method
Method | What you get |
|---|---|
Average | Average days across the deliveries in scope |
Average Delays | The same average, but over late deliveries only – how late are we when we are late |
Max | The longest number of days on any shipment line |
Min | The shortest number of days on any shipment line |
Max and Min always work at shipment-line level, whatever grouping you choose.
Which period a shipment falls into
The Sales Shipment Date Filter setting decides whether a shipment appears in the period in which it was posted or the period in which it was due (see On-Time Delivery below for the full description). Use Posting Date to report on the work done in a period, and Delivery Calculation Base Date to report on the promises that fell due in it.
Choosing your rows
In the Select Rows section you can display delivery days by any field you like – customer, item, salesperson, location, your financial dimensions, item attributes or time periods – and switch between them without rebuilding the visual. Combined with the base-date, grouping and method options, this one report gives you hundreds of views of your delivery performance and lets you find the customers, items and periods with the biggest impact. If a scenario you need is missing, tell us and we will look at including it in a future release.
On-Time Delivery
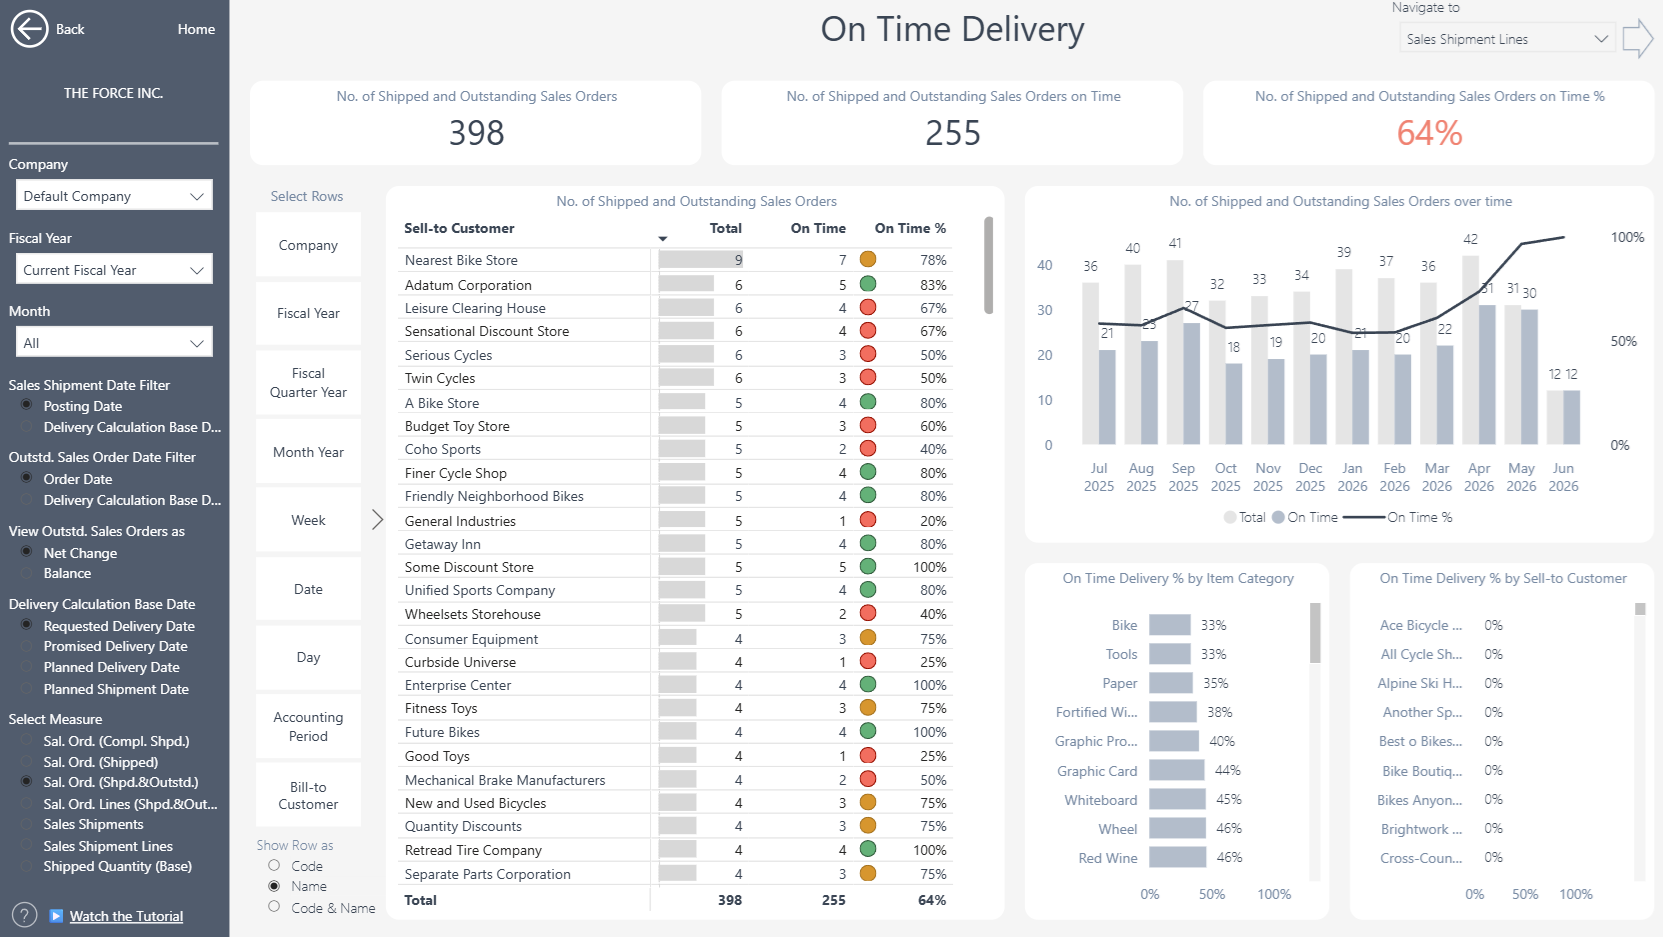 Every late delivery costs you twice: once in the complaint, the expedite and the credit note, and again when the customer quietly moves their next order elsewhere. The On-Time Delivery report shows you how reliably you deliver against the dates you commit to, at whatever level you want to manage it – orders, order lines, shipments or quantity – and lets you drill from a company-wide percentage down to the individual orders that missed.
How on-time is decided
The report works from two sources:
Posted sales shipment lines – what you have already delivered.
Open sales order lines – what you still owe (order lines with an outstanding quantity).
A posted shipment line is on time when its actual delivery date is on or before the date you committed to. The actual delivery date is the shipment's posting date plus the shipping time.
An open order line is on time as long as its committed date has not yet passed. Open lines are evaluated against the date of your most recent data refresh: a line becomes overdue once its committed date is earlier than the refresh date, so a line due on the refresh date is still on time.
Because open lines are judged against the refresh date, measures that include them describe the current state of your order book and move as time passes. Measures based only on posted shipments are historical and stay fixed.
Delivery Calculation Base Date
The "date you committed to" is your choice. A Business Central sales line can carry several delivery dates, and the Delivery Calculation Base Date selection in the left-hand menu lets you pick the one that reflects how your business makes promises:
Option | Typical use |
|---|---|
Requested Delivery Date | The date the customer asked for |
Promised Delivery Date | The date you confirmed to the customer |
Planned Delivery Date | The date Business Central calculated for delivery |
Planned Shipment Date | The date the goods were planned to leave your warehouse |
Every measure on the page recalculates against your selection.
If a line has no value for the date selected under Delivery Calculation Base Date, it is classified as on time. To exclude these lines from the analysis, open the Filters pane on the right-hand side of the report, expand the filter that matches your selected date, and deselect (Blank).
For example, the screenshot below uses Requested Delivery Date as the calculation base date, so (Blank) is deselected in the Requested Delivery Date filter. If you select a different calculation base date, apply this filter to the corresponding date field instead.
Shipment lines with a zero or negative quantity, such as undone shipments, are never classified as late.
.png) Which period a line falls into
Which period a line falls into
Two settings decide when a line is counted. Neither changes whether a line is on time; they only determine which Fiscal Year, Month or other date bucket it appears in.
Sales Shipment Date Filter – for posted shipment lines:
Posting Date – the shipment appears in the period in which it was shipped.
Delivery Calculation Base Date – the shipment appears in the period in which it was due. With Requested Delivery Date selected above, a shipment is placed in the period of its requested delivery date, regardless of when it was posted.
Outstd. Sales Order Date Filter – for open order lines:
Order Date – the line appears in the period in which the order was taken.
Delivery Calculation Base Date – the line appears in the period in which it is due.
Choose Posting Date / Order Date when you want to report on the work done in a period. Choose Delivery Calculation Base Date when you want to report on the promises that fell due in a period – usually the better fit for a customer-facing service level.
View Outstd. Sales Orders as
Net Change includes only the open lines dated within the selected period.
Balance includes every line still open whose date (Order Date or Delivery Calculation Base Date, per the setting above) is on or before the end of the selected period. This gives you an order-book view rather than a per-period movement. The cut-off is the end of the selected period or, if that is later, the date of the most recent Business Central entry or data refresh.
Select Measure
Use the Select Measure menu on the left to change what is being counted. The label shown in the menu is in brackets. Each measure comes with an on-time count and an On-Time % (the on-time count divided by the total).
Measure | What is counted | When it is on time |
|---|---|---|
Completely Shipped Sales Orders (Sal. Ord. (Compl. Shpd.)) | Orders with at least one posted shipment and no remaining outstanding quantity on any line | None of its shipment lines were late |
Shipped Sales Orders (Sal. Ord. (Shipped)) | All orders with at least one posted shipment, including partially shipped orders | None of its shipment lines were late and none of its remaining open lines are overdue |
Shipped and Outstanding Sales Orders (Sal. Ord. (Shpd.&Outstd.)) | Every placed order – shipped, partially shipped or not yet shipped | None of its shipment lines were late and none of its open lines are overdue |
Shipped and Outstanding Sales Order Lines (Sal. Ord. Lines (Shpd.&Outstd.)) | The same scope at sales order line level | None of the line's shipments were late and any open remainder is not overdue |
Sales Shipments | Posted sales shipments | None of its lines were late |
Sales Shipment Lines | Posted sales shipment lines | The line itself was not late |
Shipped Quantity (Base) | Total shipped base quantity | The quantity on lines that were not late |
A few things worth knowing when you choose between them:
Completely Shipped Sales Orders is closest to the Sales Order OTIF (On Time & In Full) metric, but interpret it in light of your order-management practices in Business Central – see 'Fill Rate' and 'In Full' Delivery Metrics Limitations in Business Central below.
Shipped and Outstanding Sales Orders is the only order-level measure that also counts orders with no shipment yet, so it is the one to use for a complete picture of your order book.
Shipped and Outstanding Sales Order Lines weights a large order and a small one in proportion to the number of lines they contain, which is often the fairer view when order sizes vary widely.
Shipped Quantity (Base) weights by volume instead, so one late line of 10,000 pieces counts for more than ten late lines of one piece each.
Worked example
A customer orders three lines, all requested for 10 June.
Line 1 ships on 5 June – on time.
Line 2 ships on 14 June – late.
Line 3 is still open on the refresh date of 20 June – overdue.
How it is counted:
Completely Shipped Sales Orders: not counted – line 3 is still outstanding.
Shipped Sales Orders and Shipped and Outstanding Sales Orders: counted once, as not on time – one late shipment is enough, and the overdue open line would have failed it anyway.
Shipped and Outstanding Sales Order Lines: three lines, one on time.
Sales Shipment Lines: two lines, one on time.
A partially shipped order is judged as a whole: it can only be on time if every shipped line was delivered on time and nothing still open is overdue. Being on time on the shipped part alone does not make the order on time.
Orders spanning more than one period
Order-level measures count each order once per period in which it has activity. An order whose first shipment posts in May and whose second line is still open in June appears in both months. Period values are therefore not additive: the annual total is the number of distinct orders in the year, not the sum of the twelve months.
Summary of the rules
On time is measured against the delivery date you select as the base date.
A shipment line is late when its actual delivery date (posting date plus shipping time) is after the base date.
An open line is late when its base date is before the refresh date.
Blank base dates and zero or negative shipment quantities are never late.
An order or order line is on time only if nothing about it – shipped or still open – was or is late.
Fill Rate
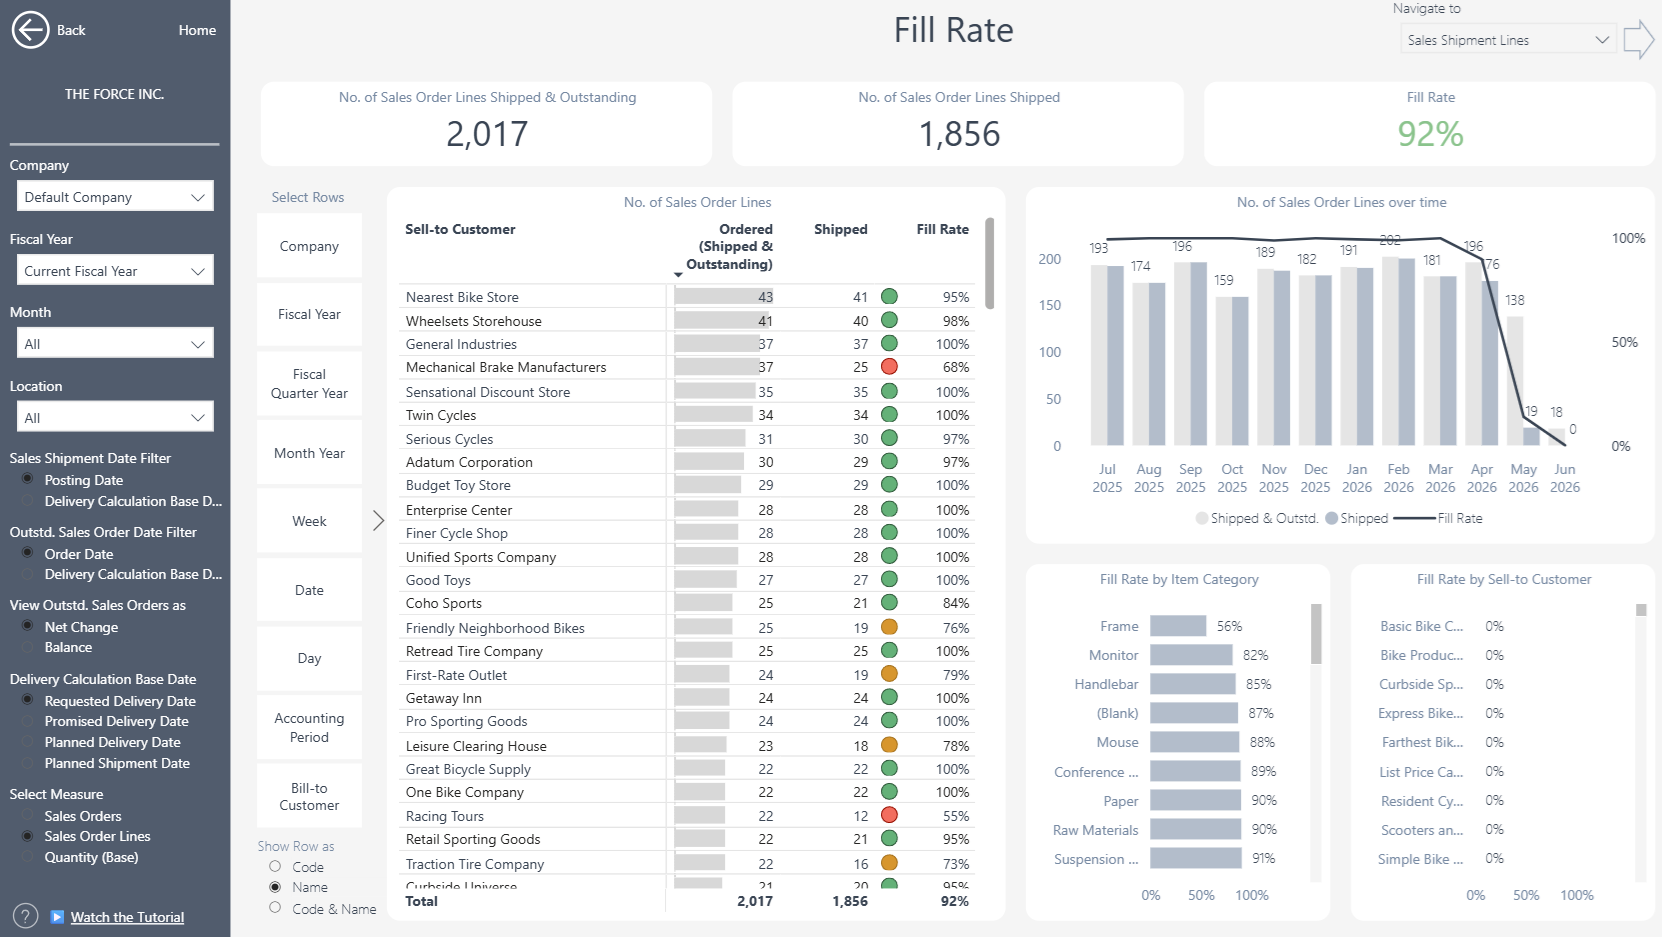 Fill rate measures how much of what customers ordered you were able to ship from stock, without back-orders. It is one of the clearest indicators of whether your inventory is keeping up with demand, and the natural companion to On-Time Delivery: one tells you whether you delivered when you promised, the other whether you delivered what was ordered.
Use the Select Measure menu on the left to choose the level:
Measure | Formula |
|---|---|
Sales Orders | Completely shipped orders ÷ all placed orders (shipped, partially shipped and outstanding) |
Sales Order Lines | Completely shipped order lines ÷ all order lines (shipped, partially shipped and outstanding) |
Quantity (Base) | Shipped base quantity ÷ shipped plus outstanding base quantity |
Sales Orders is the most widely used view: the share of orders you could supply in full.
Sales Order Lines shows the completeness of supply item by item, so one missing line on a large order does not hide the nine lines that shipped.
Quantity (Base) matters most to distributors and wholesalers, where a short shipment of a large line is a bigger problem than a missing line of one piece.
The denominators are the same "shipped and outstanding" counts used by the On-Time Delivery report, so the Outstd. Sales Order Date Filter and View Outstd. Sales Orders as (Net Change / Balance) settings described above work the same way here: they decide which period each open line belongs to and whether you see a per-period movement or an order-book balance.
In standard Business Central the Fill Rate and "In Full" metrics have limitations that come from how open orders are maintained. These are discussed in the last section of this article.
Delivery Cube and Delivery by Period
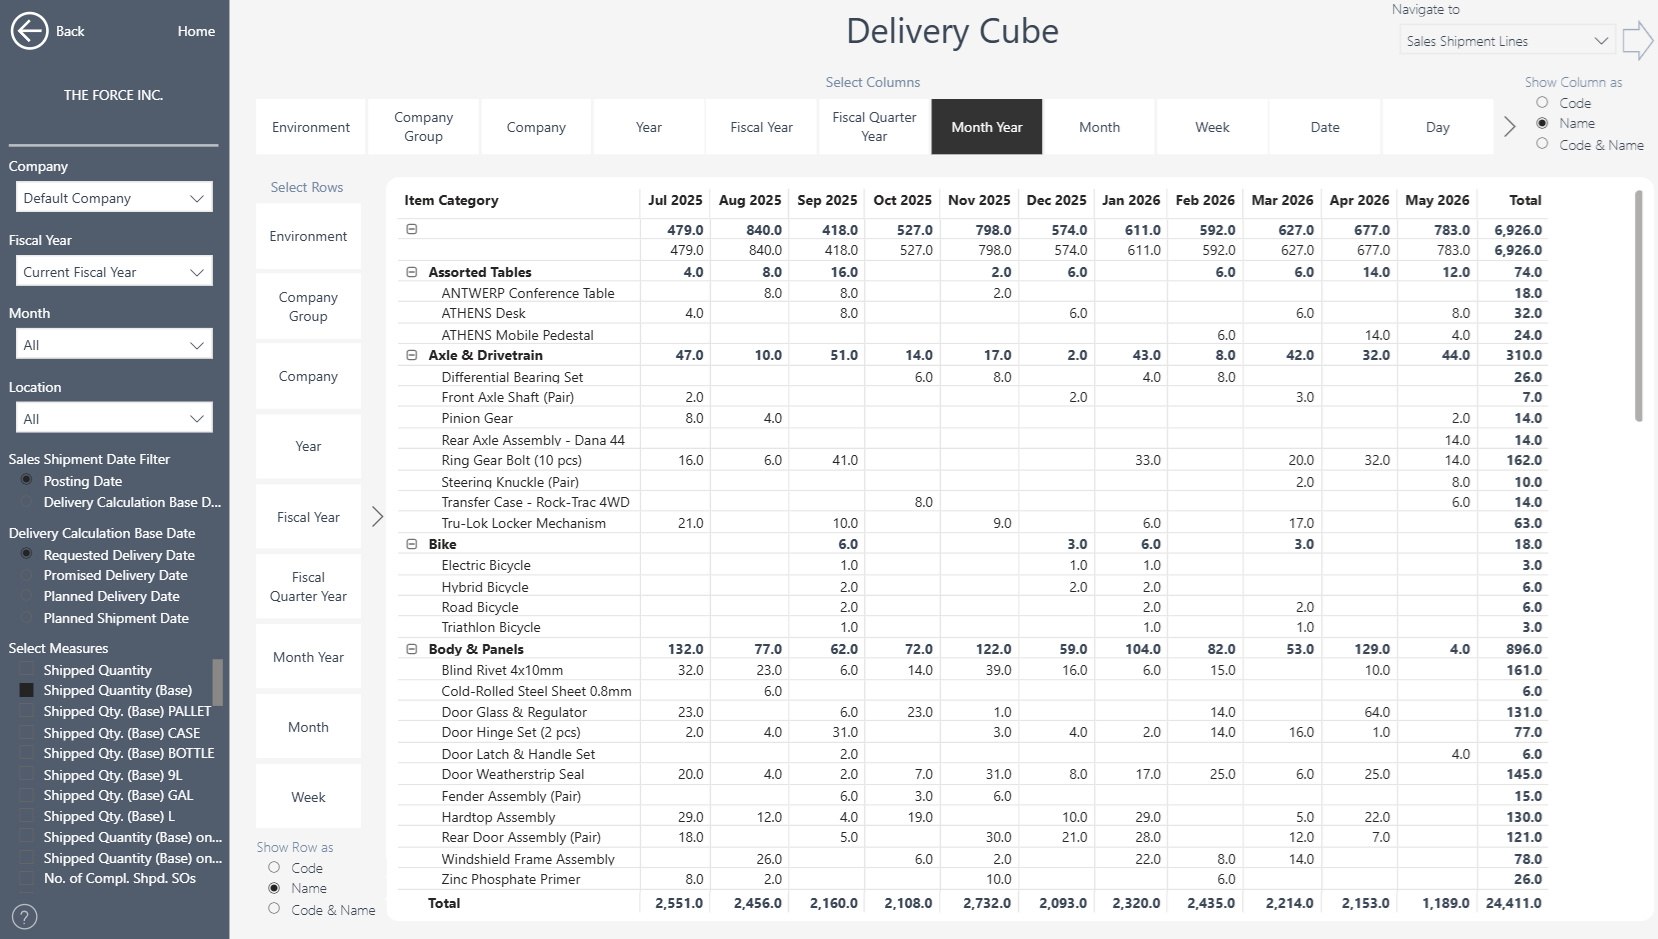 The Delivery Cube lets you place any of the delivery measures side by side and organise them the way your analysis needs – for example Actual Delivery Days, On-Time % and Sales Order Fill Rate by customer and month in one matrix.
Select several measures or fields at once with Ctrl + click, put fields on rows or columns, or build hierarchies from several fields. The full instructions for working with cube reports are in the Cube Tutorial.
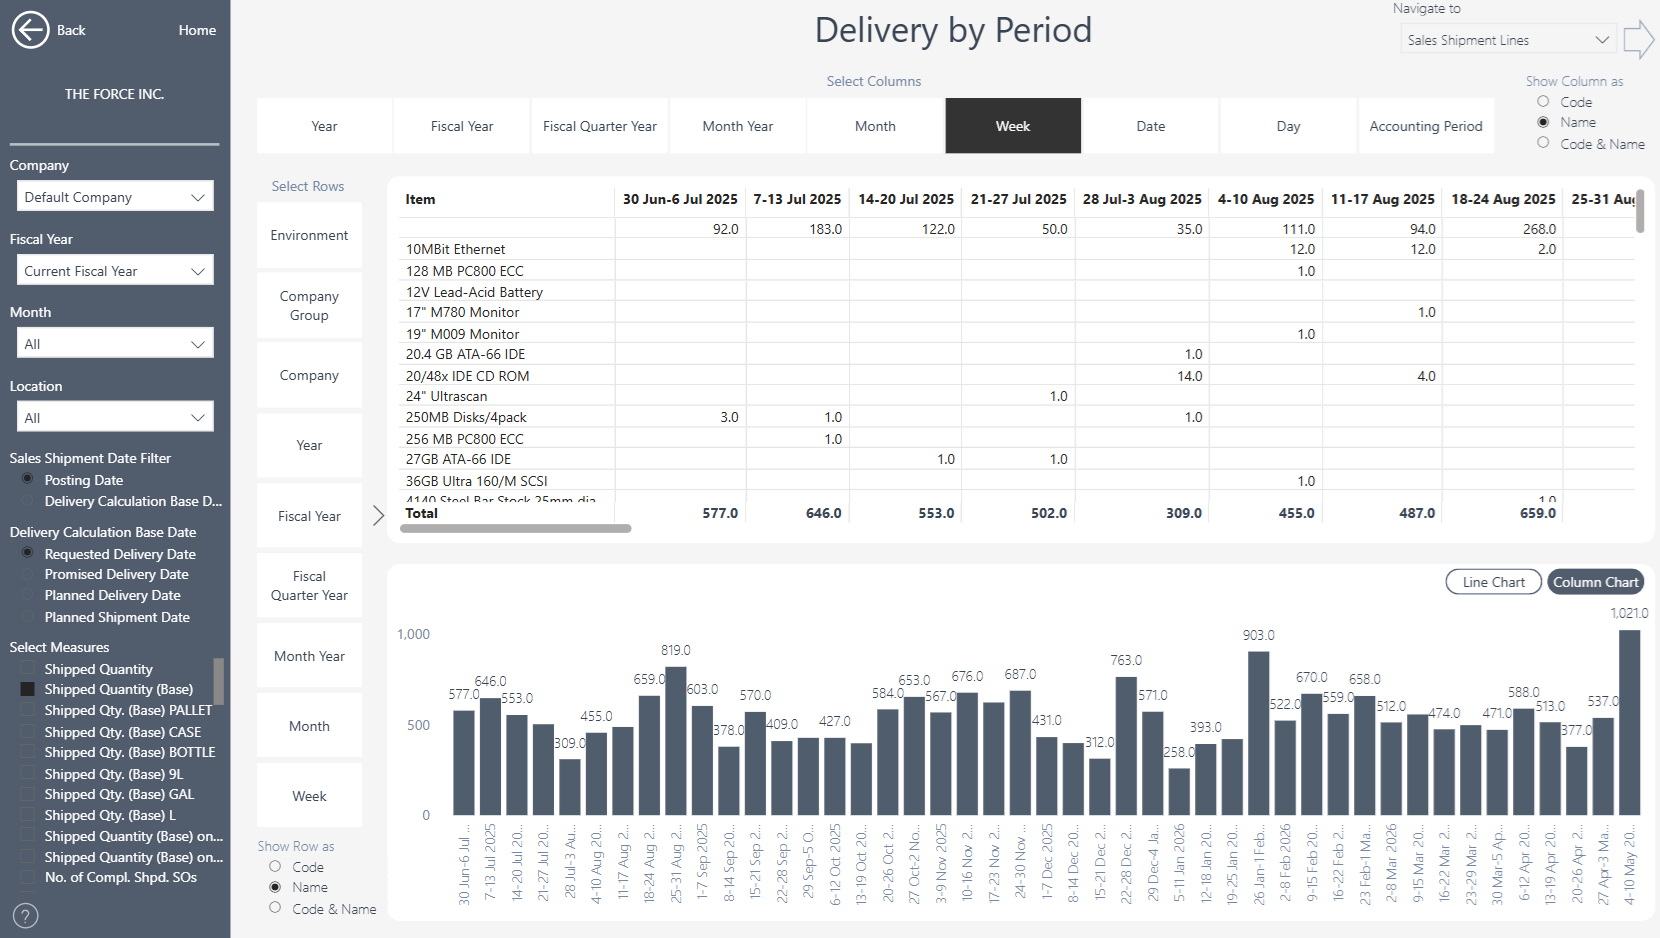 Delivery by Period presents the same delivery measures across your chosen time periods, so you can follow the trend and spot the months where performance moved.
'Fill Rate' and 'In Full' Delivery Metrics Limitations in Business Central
In practice, orders are not always shipped in full: an item may be unavailable or significantly delayed. Business Central users handle this in several ways, and each leaves a different trace in the data:
If the customer will not accept the delay, the remaining lines or quantities are usually deleted from the order.
If the customer accepts the delay, the order is either left open until the remaining lines ship, or adjusted to what was actually delivered and a new order created for the remainder with a new promised date.
Keeping a clean order book by removing obsolete or unfulfillable lines is good practice and essential for reliable MRP and inventory planning. But it also changes the numbers: the Fill Rate measures, the Completely Shipped ("In Full") measures and the On-Time Delivery measures that include outstanding orders are all calculated from the open order lines as they stand at the time of the refresh. An order that was trimmed to what actually shipped looks completely fulfilled; the same order left open looks late. Read these metrics with your order-maintenance routine in mind, and ideally review them in step with your order-book clean-up cycle.
Business Central Insights deliberately does not use archived sales orders to reconstruct what was originally ordered. Orders and order lines are deleted or amended for many reasons, and an approach that depended on a particular implementation practice would be wrong for everyone who follows a different one. Where a customer's process makes archived orders a reliable source, they can be brought in as a customisation of the app.
Other Linked Topics & Feedback
The same analysis for your suppliers – Receipt Days, On-Time Receipt and Vendor Fill Rate – is in the Purchasing Insights app; see the Receipt Analytics tutorial.
As always, please share your feedback with us. We are continually improving our apps and will do our best to include your suggestions in future releases.