Using Copilot with Business Central Insights

What is Copilot?
Copilot in Power BI lets you interact with your data using plain English.
Instead of manually analysing reports, you can:
Ask questions
Generate summaries
Identify trends and risks
Create new reports instantly
For BCI users, this means:
faster insights, less manual analysis, and better decision-making.
Why this matters
Copilot sits on top of your BCI semantic model, so it already understands:
financial structures
measures (Revenue, COGS, EBITDA)
dimensions (Customer, Department, Category)
📌 Important update
Microsoft is replacing the legacy Q&A feature with Copilot:
👉 https://powerbi.microsoft.com/en-au/blog/deprecating-power-bi-qa/
How to enable Copilot
Open Power BI Service and go to your Workspace
In Settings, assign the workspace to a Fabric or Premium capacity (e.g. F2 or P1 and above)
Go to the Admin portal → Tenant settings
Enable:
Copilot / Copilot and Azure OpenAI Service
Start using Copilot
Open a report in Power BI Service
Click the Copilot icon
Begin querying or generating insights
👉 Setup guide:
https://learn.microsoft.com/power-bi/create-reports/copilot-introduction
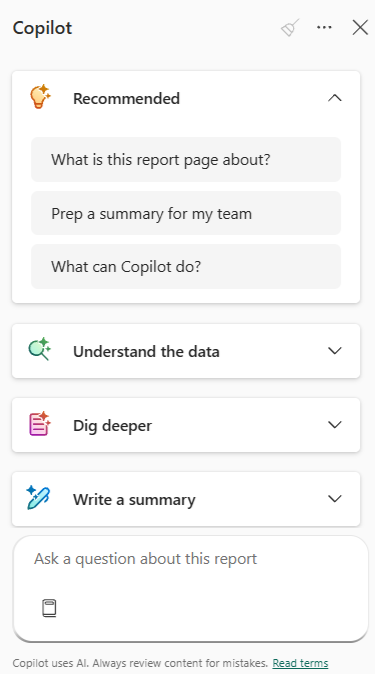
Understand your reports instantly
Start with pre-set prompts
👉 Try:
“What is this report page about?”
“Give me an executive summary of this report”
or open the drop downs for further pre-set prompts
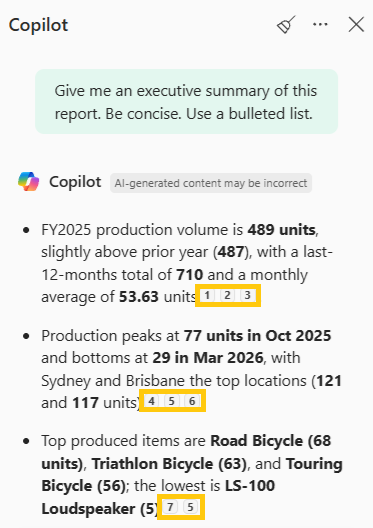
 👉 You’ll get:
bullet point summaries
key metrics highlighted
references to visuals
How Copilot uses your data
Copilot can query the entire semantic model, but the scope depends on the prompt you use.
Some prompts are page-specific, for example:
“What is this report page about?”
👉 Only summarises the current report page
Other prompts are model-wide, for example:
“Give me an executive summary of this report”
👉 May include insights from multiple reports across the model
👉 See Understanding references below to validate where insights are coming from.
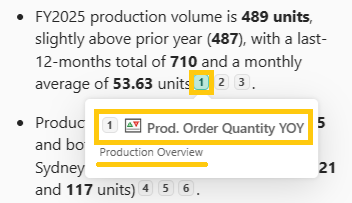
Understanding references in Copilot responses
When Copilot generates a summary, you’ll see small reference numbers next to key statements.
 These allow you to trace exactly where the insight came from.
How to use them
Hover over a reference number
See the report and visual the data came from
View the specific metric or measure
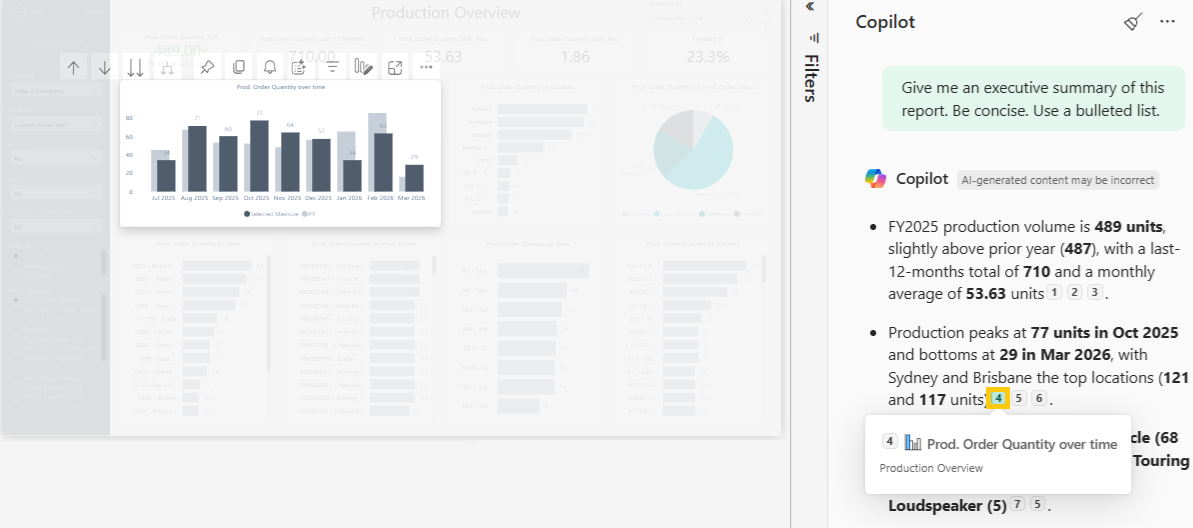
Click a reference number
Jump directly to the source report and visual
Why this matters
Confirms data accuracy and transparency
Helps you understand which reports are driving insights
Prevents confusion when summaries include data beyond the current page
Drill into visuals
Every visual or KPI has a Copilot summary icon.
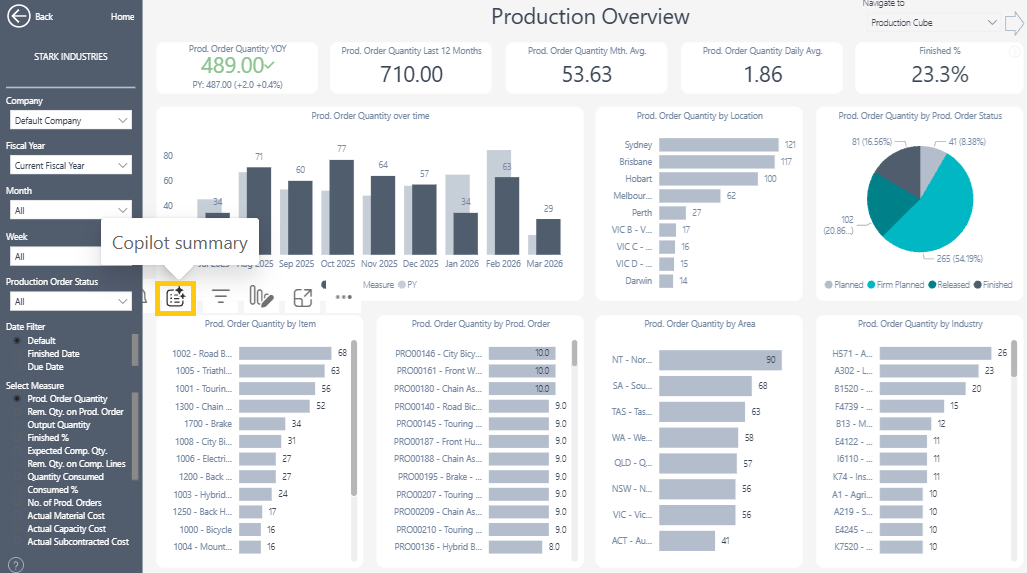 Use it to:
explain a KPI or visualization
understand drivers
get deeper context
Ask your own questions
 Examples:
“Why is COGS over budget?”
“What is driving EBITDA this month?”
“Are there any red flags in working capital?”
“Where can we cut costs with minimal impact on margin?”
👉 Copilot will:
identify drivers
highlight risks
suggest areas to investigate
Tailor insights to your audience
Try:
“Summarise this for the CFO”
“Explain this for a Sales team”
Copilot adjusts:
tone
detail
focus
📌 It may calculate additional metrics dynamically to suit the audience

Create new reports with Copilot in Power BI Service
Step 1: Create a report
Go to your Workspace
Find the BCI semantic model
Click … (More options)
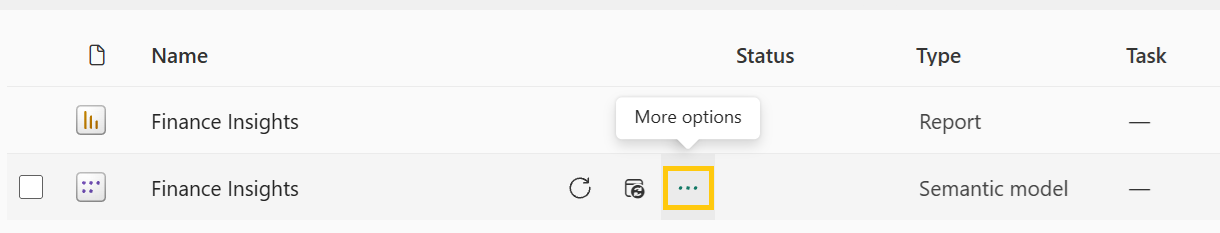
Select Create report
Step 2: Open Copilot
Open Copilot on the report canvas
Start prompting
Example
“Create a monthly trend of EBITDA Margin from Jan 2025 to present”
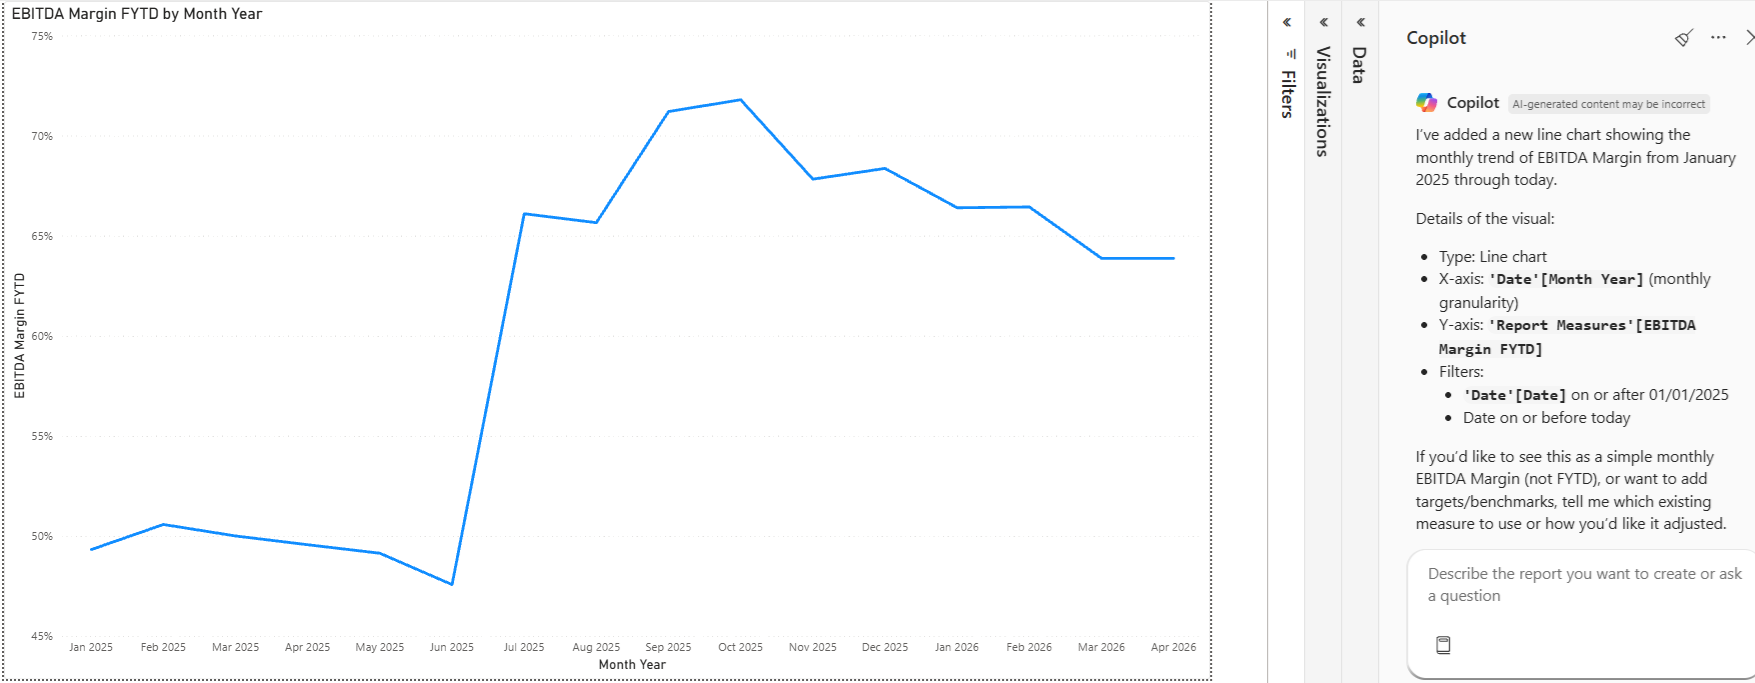 It will give details of how the visual has been created as well as suggestions on what you might want to add to the visual.
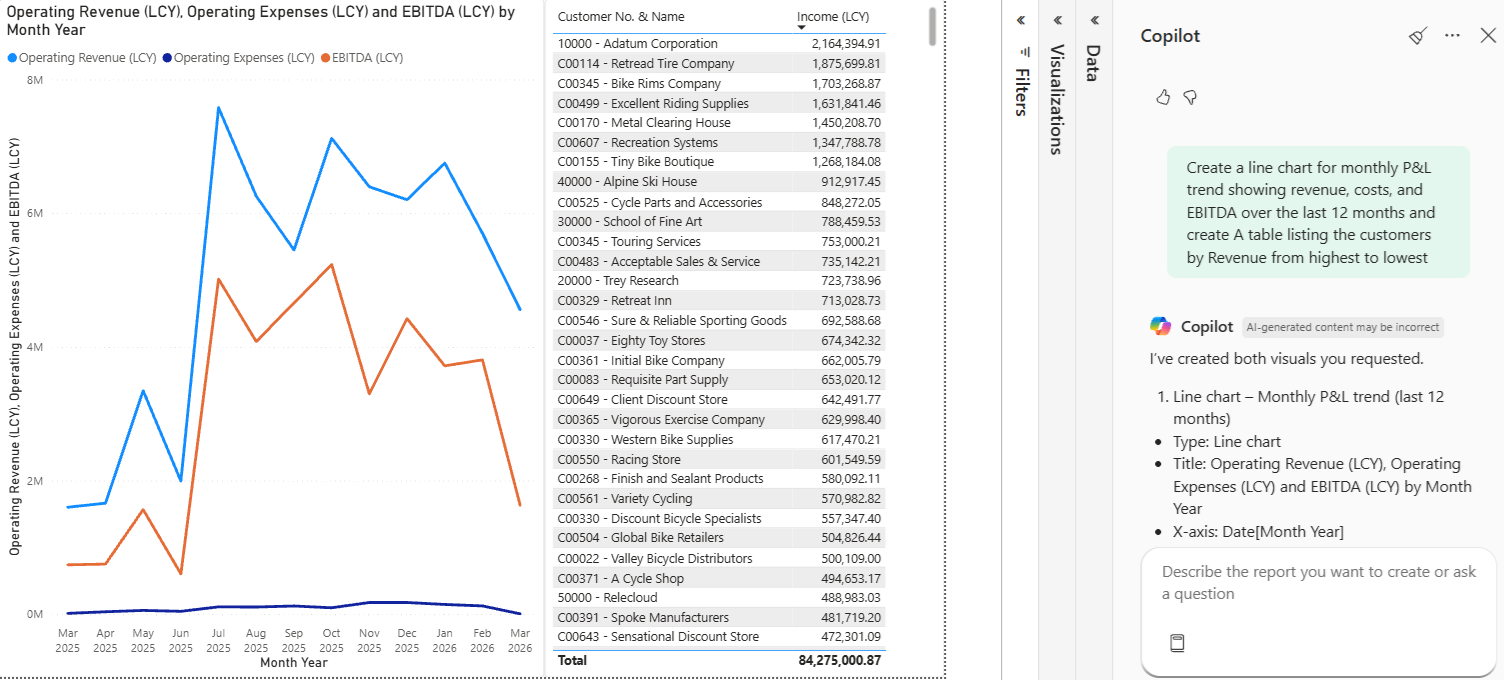
Build multiple visuals at once on one page
Try:
“Create a line chart for monthly P&L trend showing revenue, costs, and EBITDA over the last 12 months and create a table listing the customers by Revenue from highest to lowest”
 Create new reports with Copilot in Power BI Desktop
Step 1: Connect to your BCI semantic model
Open Power BI Desktop
Click Get Data
Select:
Power BI semantic models
Choose your BCI dataset
Click Connect
👉 This loads your governed model with all measures and relationships.
Step 2: Open Copilot in Desktop
In the top ribbon, go to:
Home
Click:
Copilot
👉 This opens the Copilot pane on the right-hand side.
Step 3: Start create visuals with prompts
You can now describe what you want in plain English.
What’s the difference between Power BI Desktop vs Service
In Desktop:
More control over layout and formatting
Better for refining reports
In Service:
Faster for quick report creation
More suited to business users
What to expect
visuals may be basic initially
you may need to refine them
best used as a starting point
Build out your report page
Repeat with additional prompts to create:
Supporting visuals
Comparisons
Breakdowns
Best practices
Be specific with prompts
Include timeframes and measures
Validate using references
Refine prompts step-by-step
Summary
Copilot helps you:
understand reports faster
generate insights in seconds
create new visuals quickly
It turns your BCI reports into an interactive experience, not just a dashboard.
Final takeaway
With Copilot, you’re not just looking at data, you’re having a conversation with it.