Business Central Insights AI Visuals Guide

Copilot
The Business Central Insights apps also support Copilot. Copilot can be used in two key ways:
Query reports – Ask questions in plain English to understand trends, drivers, and performance
Create reports – Generate new visuals instantly using your existing Business Central Insights data model
Find more detailed information about Copilot click here.
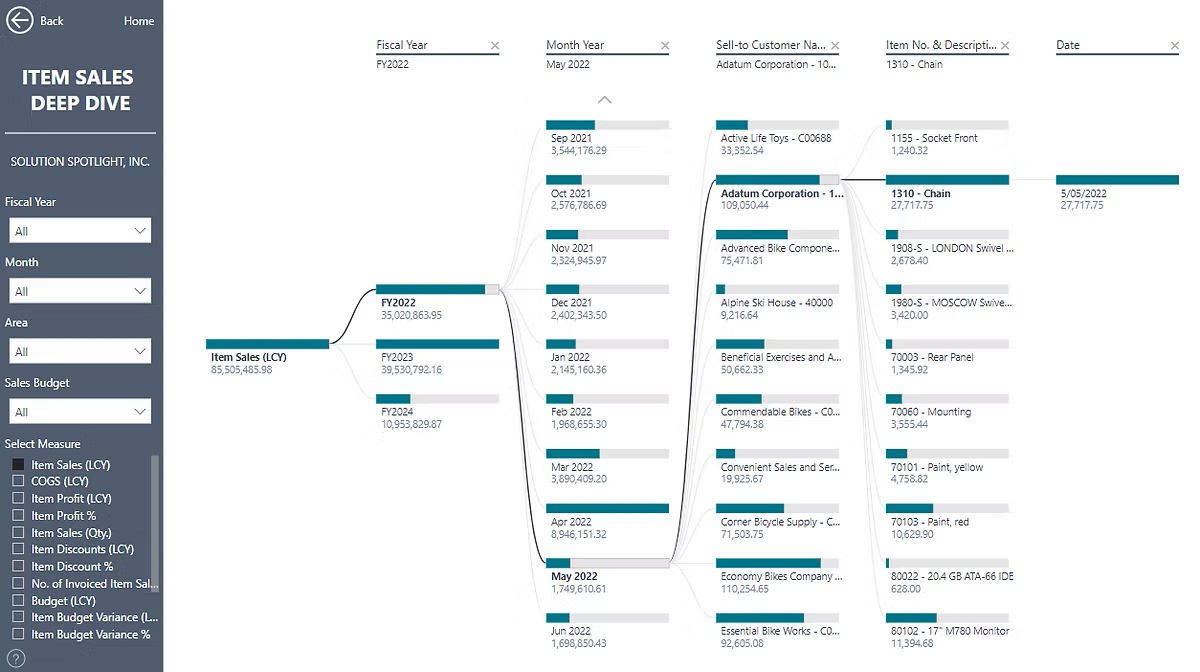
Deep Dive (Decomposition Tree)
The decomposition tree visual in Power BI lets you visualize data across multiple attributes. It automatically aggregates data and enables drilling down into your dimensions in any order. Find more about the Decomposition Tree visual here.
In Business Central Insights apps, Decomposition Tree reports are named ‘Deep Dive’. For example, ‘Item Sales Deep Dive’.
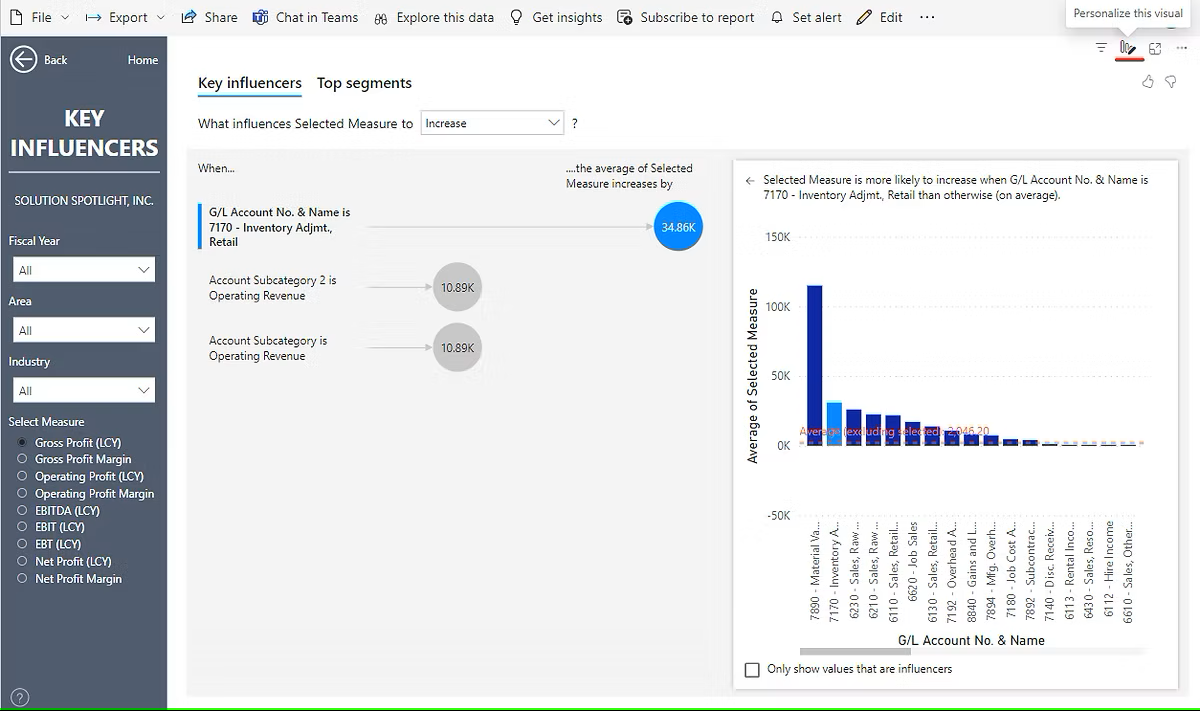
Key Influencers
The Key Influencers visual shows you what things are important for a metric you care about. It looks at your data, figures out which things matter most, and shows them to you as key influencers. Find more information here.
Key Influencers reports are available in all Business Central Insights apps. You can personalize this visual and select the measure you want to analyze, along with parameters to explain the measure.