How to configure G/L Account Categories?

G/L Account Categories in Business Central
The foundation for accurate Power BI financial reporting
G/L Account Categories define the financial structure of your Business Central data. Business Central Insights uses this structure directly to build accurate Balance Sheets, Income Statements, Cash Flow Statements, and financial KPIs in Power BI.
If G/L Account Categories are missing or incomplete, Power BI reports may show blank lines, incorrect totals, or inaccurate financial ratios. This setup is therefore essential before reviewing or relying on any financial reports.
Why G/L Account Categories matter for Power BI
Many of the Business Central Insights financial reports rely on G/L Account Categories to correctly interpret your chart of accounts. These categories tell Power BI how each G/L account should behave in financial statements and calculations.
They are used to calculate key metrics such as: EBITDA, Working capital, Current ratio, Quick ratio, Liquidity ratios
Even if you customise how reports are presented, these mappings ensure Power BI always understands what each account represents from an accounting perspective.
Check if G/L Account Categories are configured
G/L Account Categories are a standard feature in Business Central, but they are not always fully configured.
To check your setup:
Search for G/L Account Categories in Business Central
Open the page
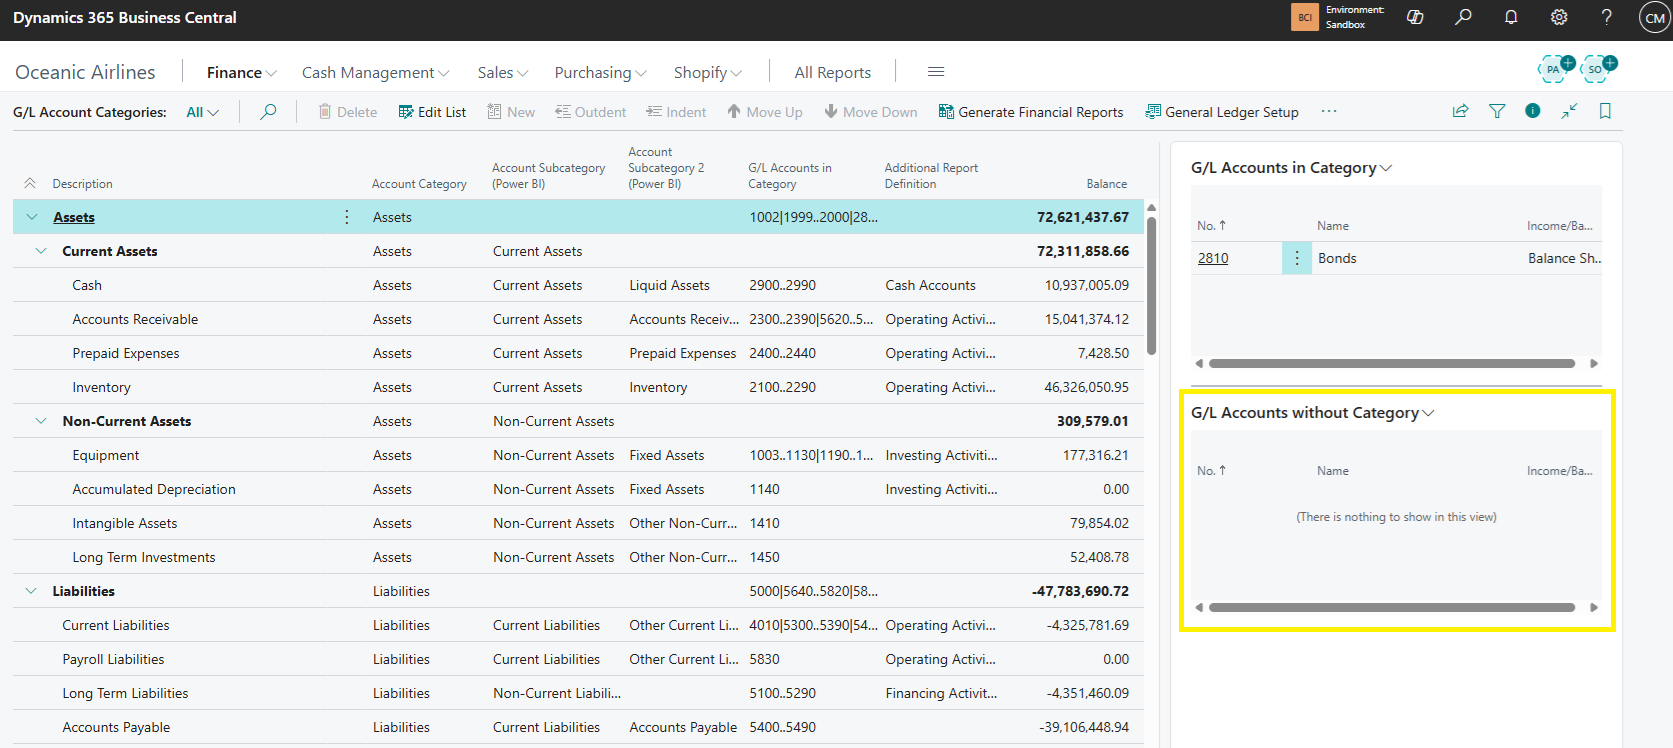
In a new or lightly configured environment, you may see default categories with no G/L accounts assigned. This means the structure exists, but the setup is incomplete.
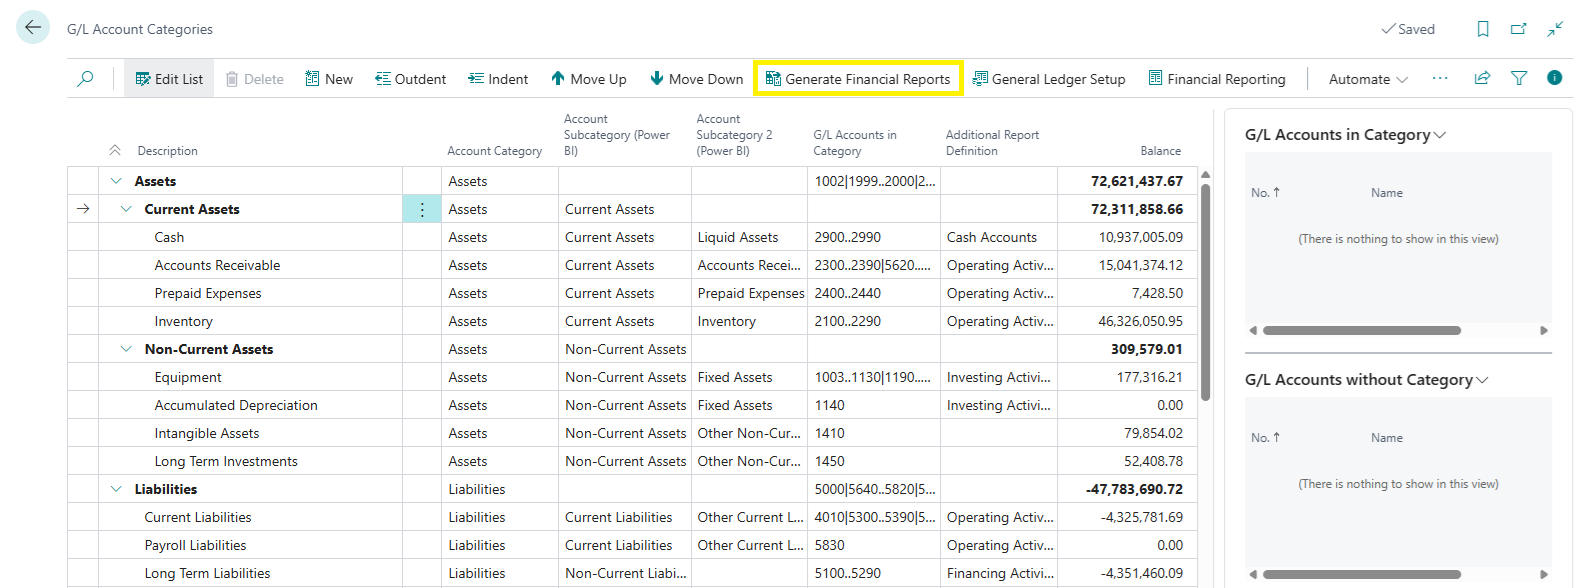
On the right-hand side, check the G/L Accounts without Category fact box. If this is not empty, some accounts are not mapped and Power BI financial reports may be incomplete.
Single-company vs multi-company environments
If you are working with a single company, this setup only needs to be completed once.
If you are using multiple companies, each company must be configured using the same category structure. For consolidated Power BI reporting, it is critical that:
Category names are identical
The hierarchy structure is identical
The order of categories is identical
If categories do not align between companies, consolidated reports may show duplicated or misaligned lines.
Editing and maintaining G/L Account Categories
You can fully customise the category structure to match your financial reporting requirements via Edit List.
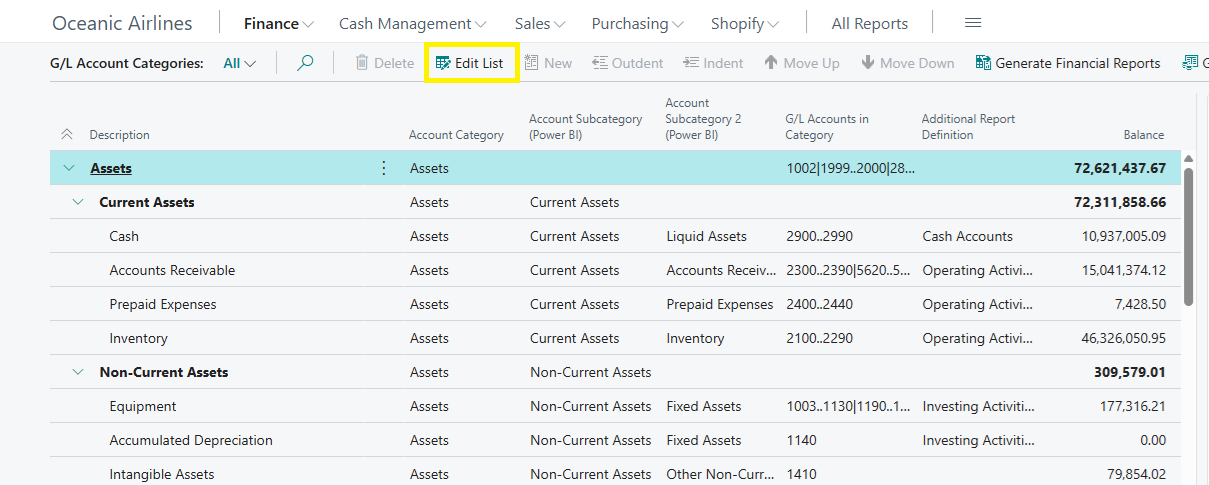
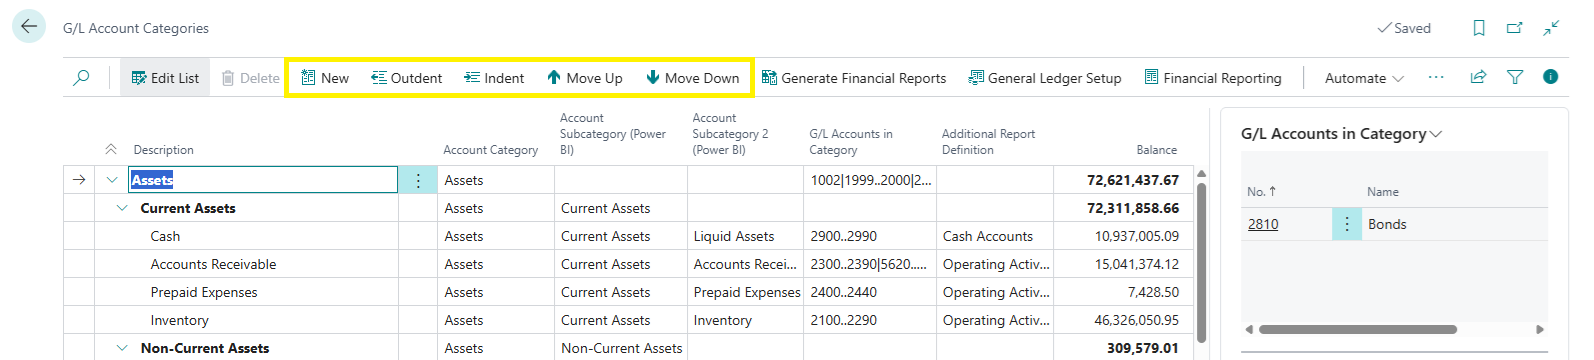
From the G/L Account Categories page you can:
Rename categories to match your reporting structure
Add new categories using New
Adjust the hierarchy using Indent and Outdent
Reorder categories using Move Up and Move Down
A good starting point is to open the Chart of Accounts in another tab and mirror the structure you already use there. You can keep the structure simple initially and refine it later as reporting needs evolve.
What matters most is that every G/L account is assigned to a category.
Understanding category hierarchies
G/L Account Categories support multiple hierarchy levels, which are used by Power BI for financial analysis.
Think of these as structured levels:
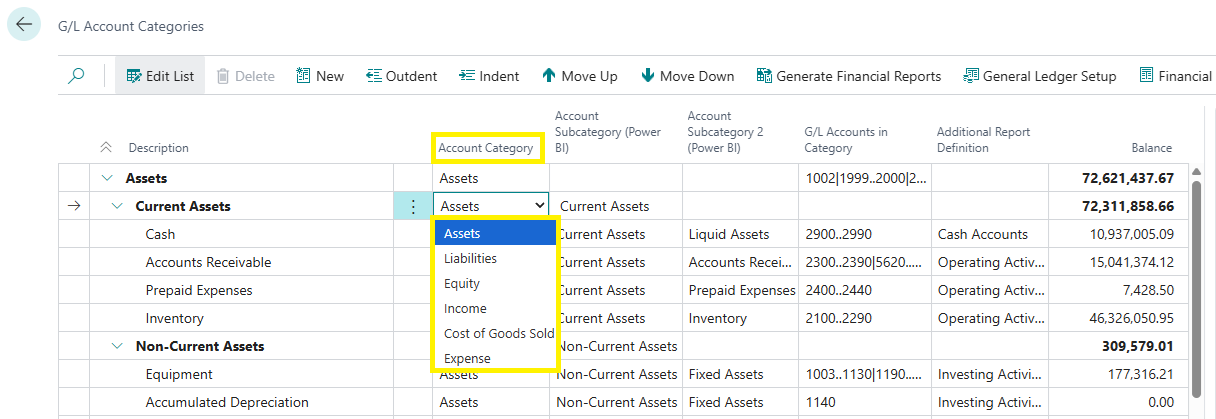
Account Category: Top-level classification (for example Assets or Income) must be populated in all rows
Account Subcategory (Power BI): Second-level grouping (for example Current Assets) must be populated in all rows except if the row is representing top level account category which includes Assets, Liabilities, Equity, Income, Cost of Goods Sold and Expenses
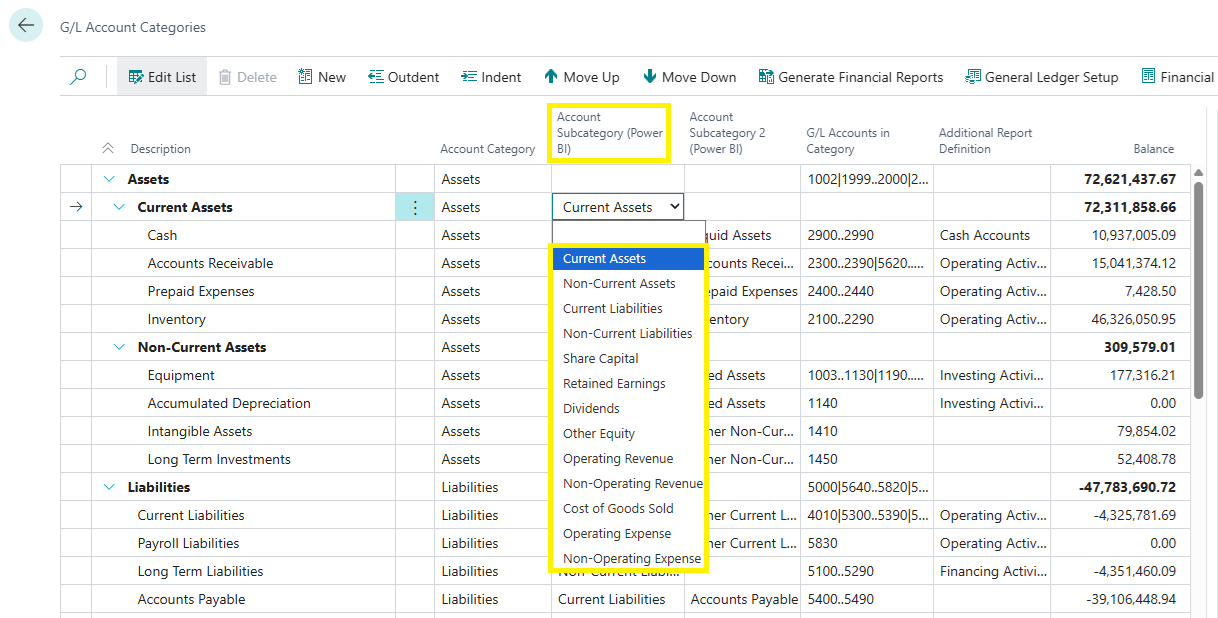
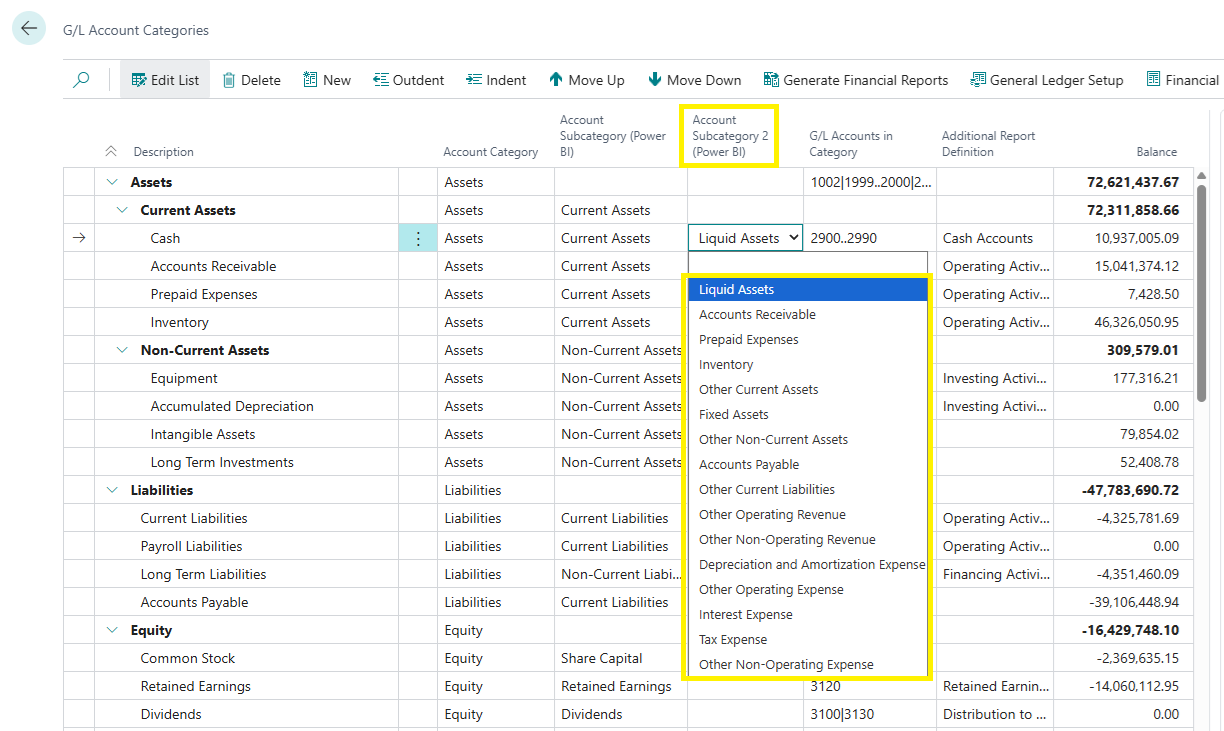
Account Subcategory 2 (Power BI): Optional third-level grouping (for example Liquid Assets) must be populated only when applicable. If you cannot find the matching value, then you can leave the Account Subcategory 2 as blank. This means that it will inherit the value from the previous level (Account Subcategory)
This allows financial data to be analysed consistently across statements and ratios.
Recommended G/L Account Category structure
Below is a recommended hierarchy that aligns with standard financial reporting and Business Central Insights calculations. You can use this as a reference when configuring your environment.
Account Category | Account Subcategory (Power BI) | Account Subcategory 2 (Power BI) |
|---|---|---|
Assets | Current Assets | |
Assets | Current Assets | Liquid Assets |
Assets | Current Assets | Accounts Receivable |
Assets | Current Assets | Prepaid Expenses |
Assets | Current Assets | Inventory |
Assets | Current Assets | Other Current Assets |
Assets | Non-Current Assets | |
Assets | Non-Current Assets | Fixed Assets |
Assets | Non-Current Assets | Other Non-Current Assets |
Liabilities | Current Liabilities | |
Liabilities | Current Liabilities | Accounts Payable |
Liabilities | Current Liabilities | Other Current Liabilities |
Liabilities | Non-Current Liabilities | |
Equity | Share Capital | |
Equity | Retained Earnings | |
Equity | Dividends | |
Equity | Other Equity | |
Income | Operating Revenue | |
Income | Operating Revenue | Other Operating Revenue |
Income | Non-Operating Revenue | |
Income | Non-Operating Revenue | Other Non-Operating Revenue |
Cost of Goods Sold | Cost of Goods Sold | |
Expense | Operating Expense | |
Expense | Operating Expense | Depreciation and Amortization Expense |
Expense | Operating Expense | Other Operating Expense |
Expense | Non-Operating Expense | |
Expense | Non-Operating Expense | Interest Expense |
Expense | Non-Operating Expense | Tax Expense |
Expense | Non-Operating Expense | Other Non-Operating Expense |
Power BI mapping rules
To ensure correct calculations in Power BI, the following rules apply:
Account Category (standard Business Central field)
Must be populated for all G/L accounts
Account Subcategory (Power BI)
Must be populated for all rows except top-level categories
Top-level categories include Assets, Liabilities, Equity, Income, Cost of Goods Sold, and Expenses
Account Subcategory 2 (Power BI)
Optional
Used only when a further breakdown is required
If left blank, the value is inherited from Account Subcategory
Not every account needs to use every level. If a level does not apply, it can be left blank without impacting reporting accuracy.
These Power BI-specific subcategories ensure financial KPIs and ratios are calculated correctly, even if categories are renamed for presentation purposes.
Generating Financial Reports in Business Central
Once G/L Account Categories are fully configured, you can automatically generate standard financial reports in Business Central.
Select Generate Financial Reports to create:
Income Statement
Balance Sheet
Cash Flow Statement
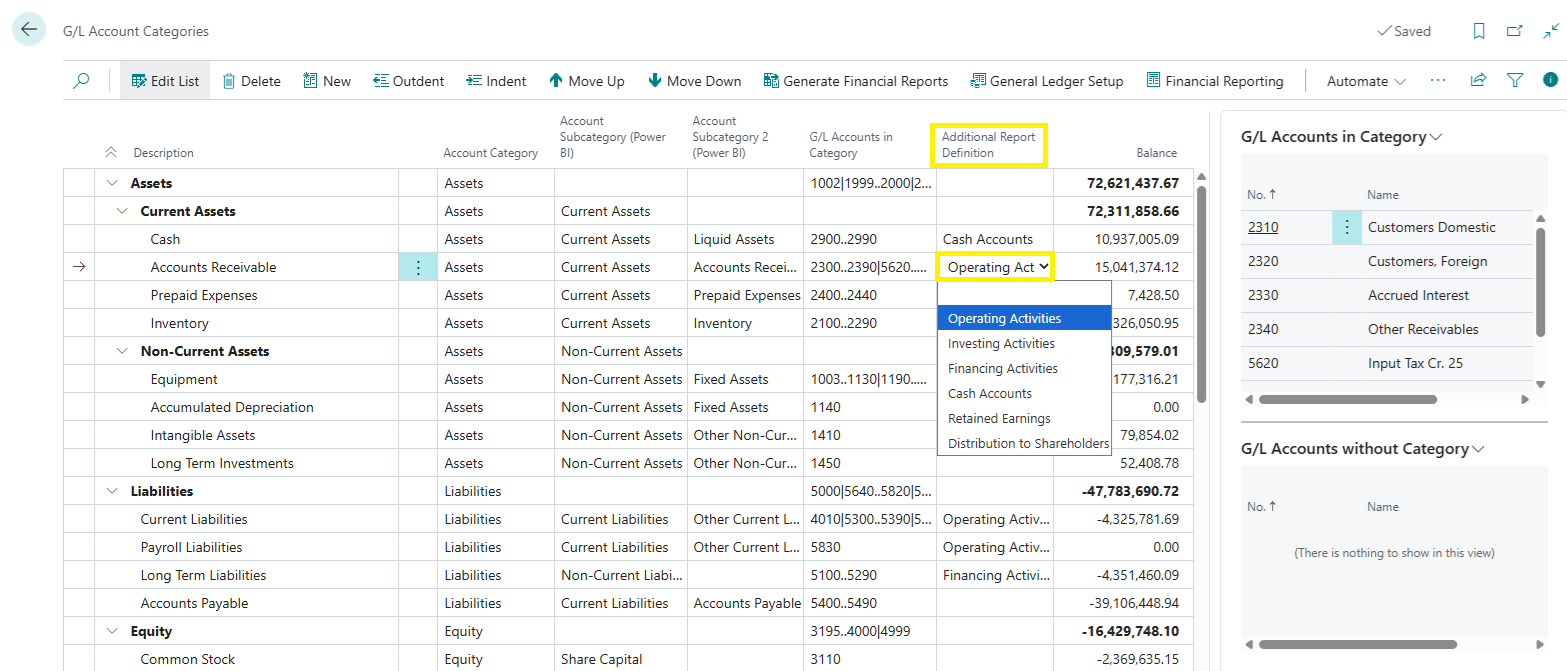
To enable Cash Flow Statement generation, ensure the Additional Report Definition column is populated before running the process.
Best practices and recommendations
Ensure every G/L account has a category
Keep the structure logical and consistent
Align categories with how finance users expect to see reports
Do not overcomplicate the structure initially
Refine the hierarchy over time as reporting needs grow
In most cases, this setup can be completed in one to two hours.
Next steps
Once your G/L Account Categories are fully mapped, your Business Central Insights Power BI reports will immediately reflect the correct financial structure.
It would be recommended to view our Financial Reporting tutorial on this page: https://businesscentralinsights.com/financial-reporting
The clearer the categories, the clearer the insight.
Recommended additional resources:
G/L Account Categories overview
Microsoft documentation explaining the purpose of account categories
https://learn.microsoft.com/en-us/dynamics365/business-central/bi-account-categories